BTC at $80,725 — Daily Crypto Technical Analysis (May 15, 2026)
BTC at $80,725 (bullish) with chart analysis, futures data, and scenario breakdown. ETH, SOL, and top altcoins analyzed.
Market Overview
The crypto market advanced with total capitalization at $2.77T (+0.8%). BTC dominance sits at 58.4% while the Fear & Greed Index reads 43 (Fear), reflecting mixed sentiment.
Bitcoin (BTC) — $80,725
▲ WEAK BULLISH (Score: 10)
Price Action & Key Levels
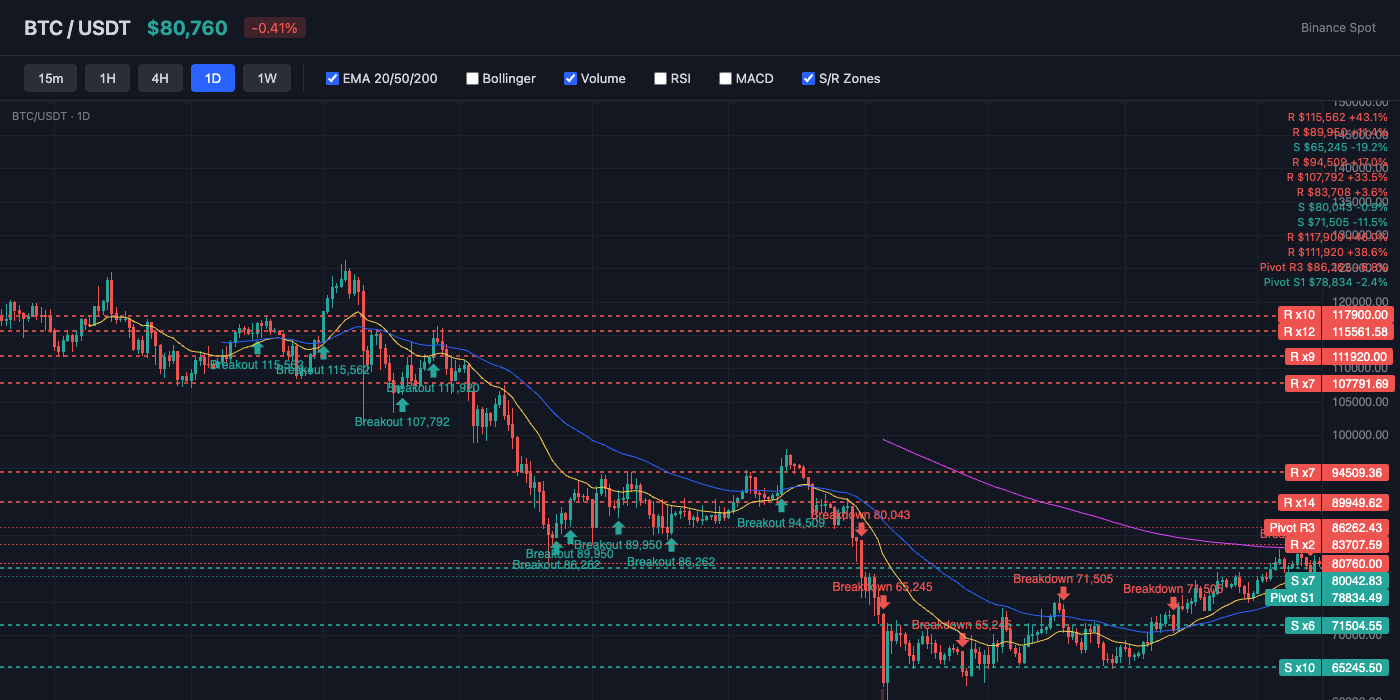
Bitcoin trades at $80,725, currently above the 20-day EMA ($79,456) and above the 50-day EMA ($76,652). The 200-day EMA at $84,276 serves as long-term resistance. Key resistance sits at $82,548 (Pivot R1), while support holds at $78,834 (Pivot S1). EMA alignment is mixed, suggesting a transitional or ranging market.
Bollinger Bands & Volatility
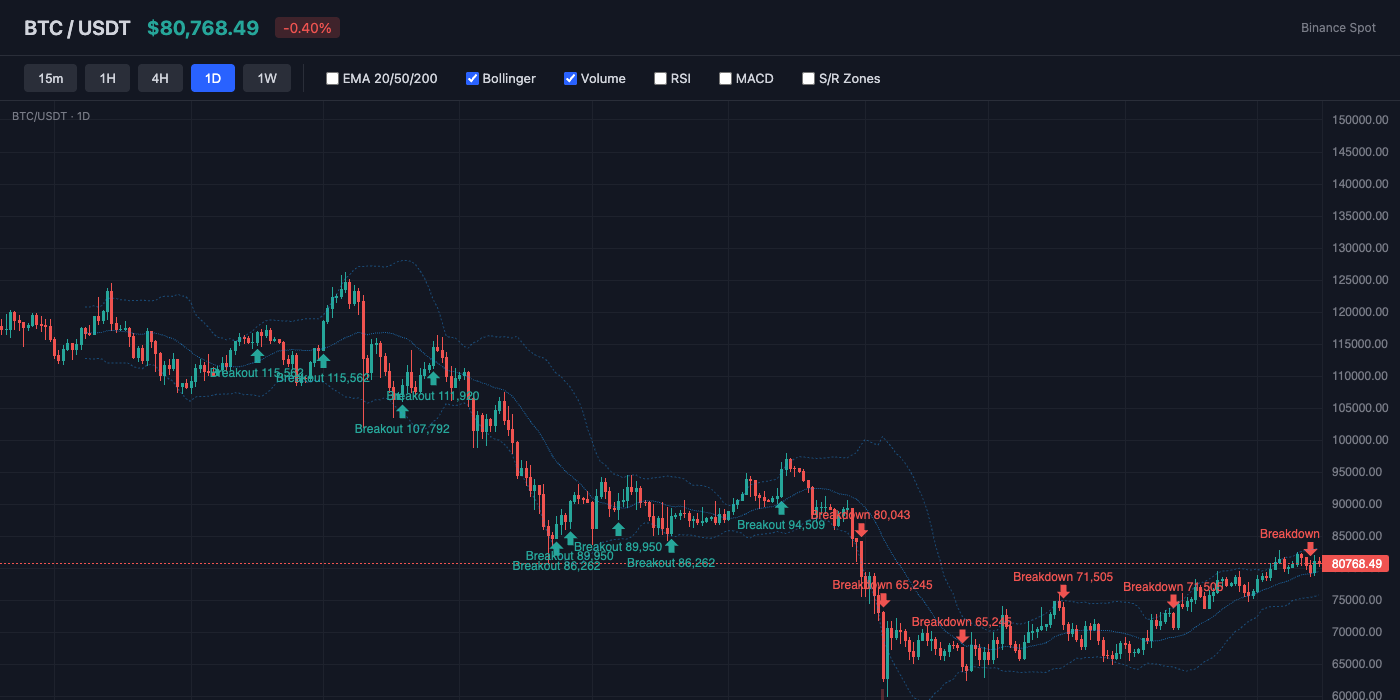
Bollinger Bands show a bandwidth of 9.4% (moderate volatility). Price is near the middle of the bands (%B: 69%), showing balanced positioning. The middle band (SMA 20) at $79,339 acts as dynamic support.
Momentum Indicators
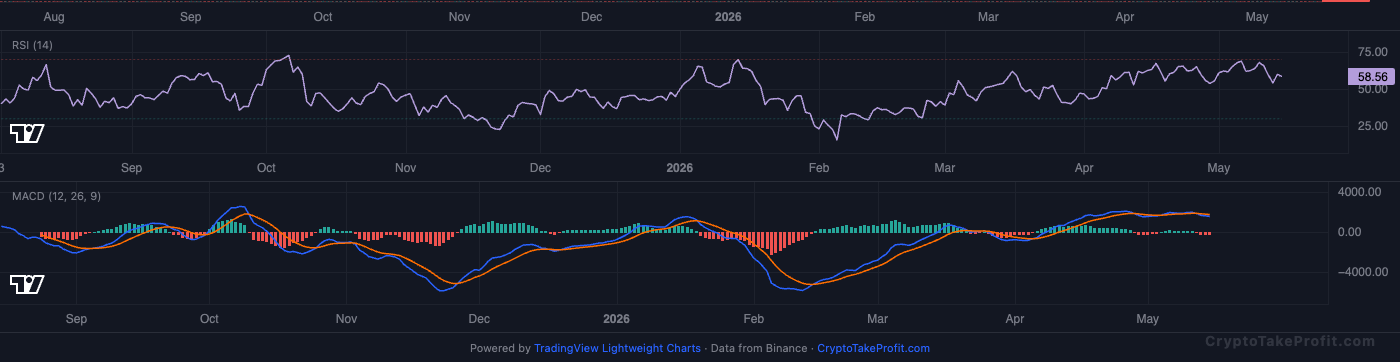
RSI reads 58.3, sitting in neutral range with no extreme readings. MACD has no active crossover, with negative histogram (-198.55) indicating downward pressure.
Market Structure
Price at 80 , 725 𝑠 𝑖 𝑡 𝑠 1.6 80,725sits1.679,456) and 5.3% above EMA50 ($76,652), per Coinglass data as of March 17, 2026. The 68.6% Bollinger Band %B indicates price is in the upper half of the band but not overbought. RSI at 58.3 suggests weak bullish momentum, while Funding Rate at -0.0019% and Long/Short Ratio at 0.91 show futures traders are positioned net short.
Volume Analysis
Volume ratio at 0.65x average, according to TradingView data over the past 24 hours. This means 35% less trading activity than normal, which makes the current price weak bullish signal less reliable. Rallies on low volume typically fail.
Key Levels
| Price | Type | Source | Significance | Distance |
|---|---|---|---|---|
| $86,262 | Resistance | Pivot R3 | Low | +6.9% |
| $84,372 | Resistance | Pivot R2 | Medium | +4.5% |
| $82,548 | Resistance | Pivot R1 | Medium | +2.3% |
| $80,725 | Current | — | — | — |
| $78,834 | Support | Pivot S1 | Medium | -2.3% |
| $76,944 | Support | Pivot S2 | Medium | -4.7% |
| $75,121 | Support | Pivot S3 | Low | -6.9% |
Moving Averages
| MA | Value | Position | Signal |
|---|---|---|---|
| EMA 20 | $79,456 | Above | Bullish |
| EMA 50 | $76,652 | Above | Bullish |
| EMA 200 | $84,276 | Below | Bearish |
| BB Middle (SMA 20) | $79,339 | Above | Bullish |
Trade Setup
BTC Scenario Analysis
Bullish Case
Trigger: Daily close above
Target: 86,200 (upper Bollinger band + 2x ATR extension)
Invalidation: Daily close below
PriceholdingabovebothEMAswithnegativefundingcreatesshortsqueezepotential.Ifshortscoverat82,548 break, the 0.65x volume could expand to 1.2x as momentum chasers enter.
Base Case
Trigger: Price trades between
Target: 80
Invalidation: Break of either support or resistance on 1.5x average volume
RSI at 58.3 and Fear & Greed at 43 (Fear) both sit in indecision territory. Low volume and no clear patterns suggest consolidation until a catalyst arrives or funding flips positive.
Bearish Case
Trigger: Daily close below
Target: 76,650 (EMA50 level)
Invalidation: Daily close back above $80,000 within 24 hours of the trigger
Weak bullish signal 10 with histogram-negative MACD and 0.65x volume means buyers are absent. A break below S1 would confirm the false breakout, and 108,227 open contracts would liquidate long positions rapidly.
Bitcoin (BTC) Resources
Altcoin Overview
Among altcoins, SOL leads with the strongest bullish signal (score: 40), while ETH shows the weakest setup (score: -15). Traders should focus on coins with clear directional signals and volume confirmation.
What to Watch
- BTC action around $80,725 for directional confirmation
- Fear & Greed at 43 for sentiment shift signals
- MACD crossover follow-through on top altcoins
- Volume confirmation on any support/resistance breaks
- BTC dominance at 58.4% for alt rotation signals


