BTC at $78,436 — Daily Crypto Technical Analysis (May 16, 2026)
BTC at $78,436 (bearish) with chart analysis, futures data, and scenario breakdown. ETH, SOL, and top altcoins analyzed.
Market Overview
The crypto market pulled back with total capitalization at $2.70T (-2.7%). BTC dominance sits at 58.3% while the Fear & Greed Index reads 31 (Fear), reflecting cautious sentiment.
Bitcoin (BTC) — $78,436
▼ WEAK BEARISH (Score: -20)
Price Action & Key Levels
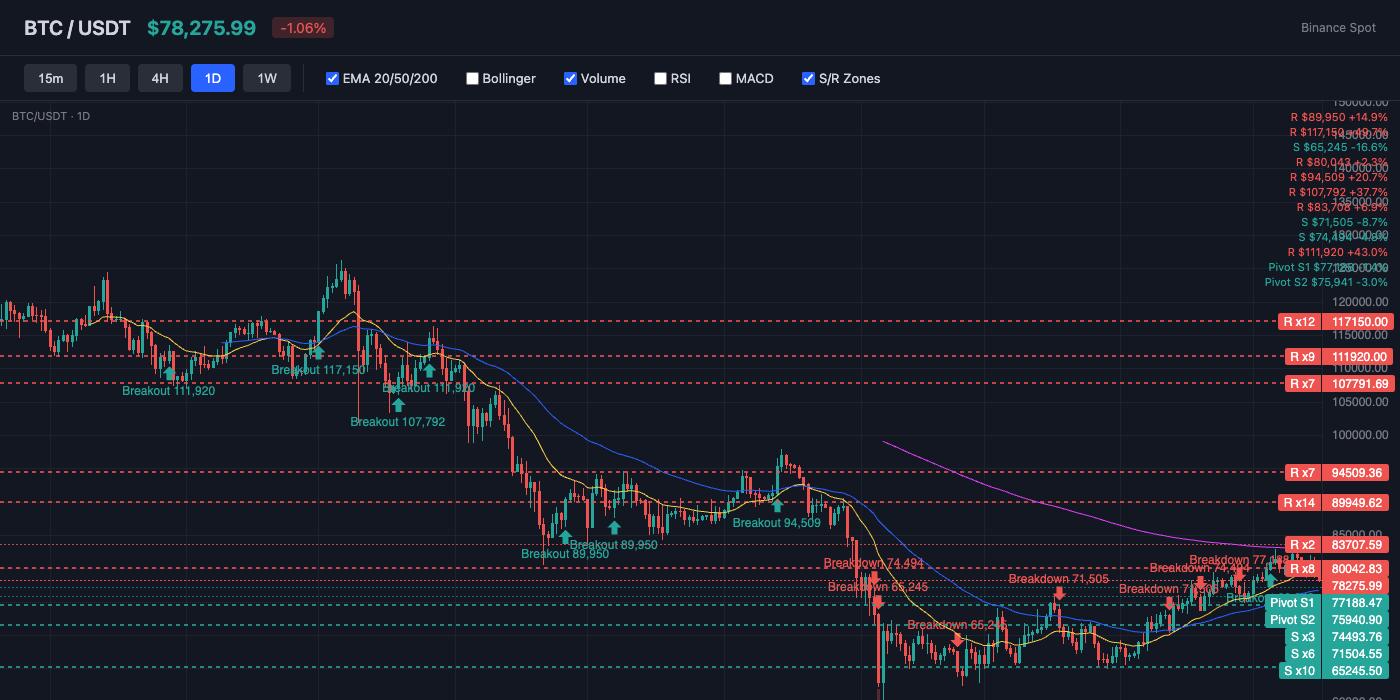
Bitcoin trades at $78,436, currently below the 20-day EMA ($79,205) and above the 50-day EMA ($76,663). The 200-day EMA at $84,240 serves as long-term resistance. Key resistance sits at $79,205 (EMA20), while support holds at $77,188 (Pivot S1). EMA alignment is mixed, suggesting a transitional or ranging market.
Bollinger Bands & Volatility
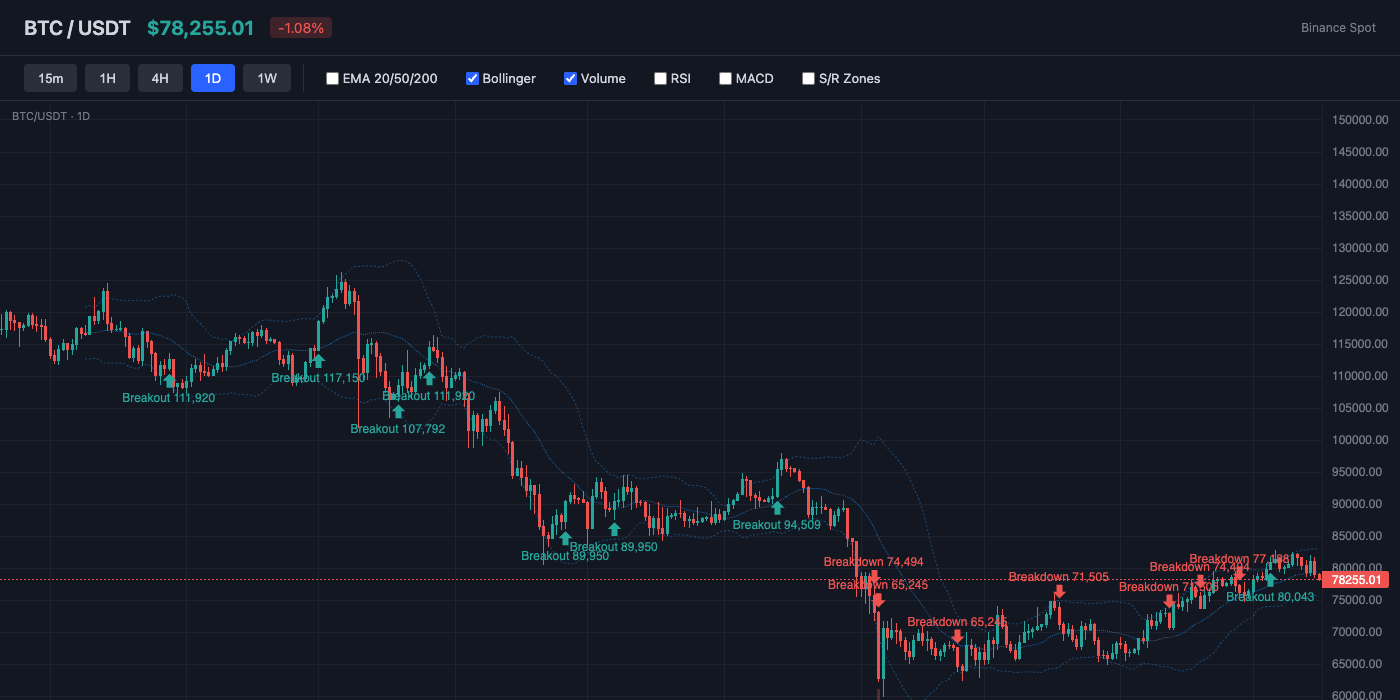
Bollinger Bands show a bandwidth of 9.2% (moderate volatility). Price is near the middle of the bands (%B: 38%), showing balanced positioning. The middle band (SMA 20) at $79,281 acts as dynamic resistance.
Momentum Indicators
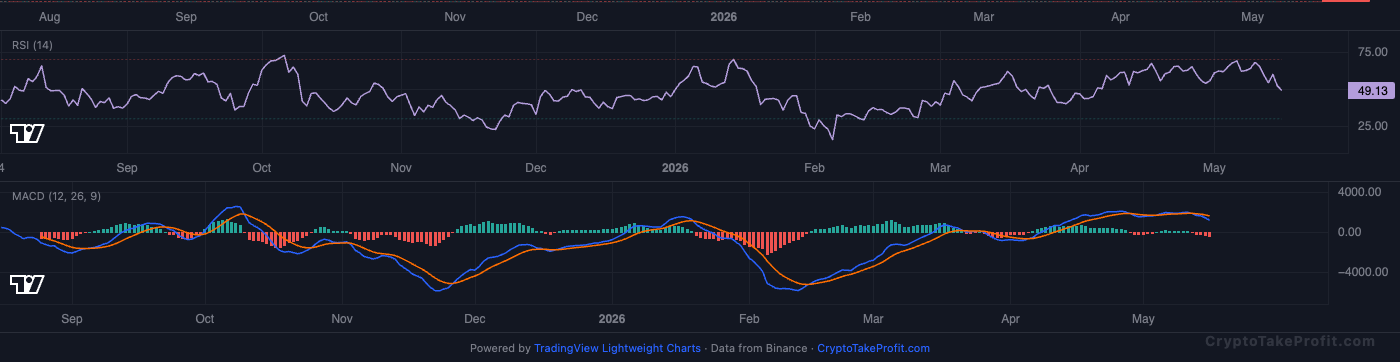
RSI reads 50.0, sitting in neutral range with no extreme readings. MACD has no active crossover, with negative histogram (-415.30) indicating downward pressure.
Market Structure
BTC trades at $78,436 as of May 2026 with mixed momentum signals after total crypto market cap fell 2.7% to $2.70T. Price remains below the EMA20 at $79,205 but above the EMA50 at $76,663, which keeps the broader structure neutral rather than fully bearish. Fear & Greed sits at 31, showing defensive positioning while RSI at 50.0 reflects balanced momentum.
Volume Analysis
Volume ratio sits at just 0.49x average, which weakens conviction behind the latest downside move. Open Interest remains elevated at 101,558 contracts while the long/short ratio stays nearly balanced at 0.98, showing neither side has full control. Funding rates at 0.0004% confirm derivatives positioning remains cautious instead of aggressively long.
Key Levels
| Price | Type | Source | Significance | Distance |
|---|---|---|---|---|
| $84,635 | Resistance | Pivot R3 | Low | +7.9% |
| $83,388 | Resistance | Pivot R2 | Medium | +6.3% |
| $80,912 | Resistance | Pivot R1 | Medium | +3.2% |
| $79,205 | Resistance | EMA20 | Low | +1.0% |
| $78,436 | Current | — | — | — |
| $77,188 | Support | Pivot S1 | Medium | -1.6% |
| $75,941 | Support | Pivot S2 | Medium | -3.2% |
| $73,465 | Support | Pivot S3 | Low | -6.3% |
Moving Averages
| MA | Value | Position | Signal |
|---|---|---|---|
| EMA 20 | $79,205 | Below | Bearish |
| EMA 50 | $76,663 | Above | Bullish |
| EMA 200 | $84,240 | Below | Bearish |
| BB Middle (SMA 20) | $79,281 | Below | Bearish |
Trade Setup
BTC Scenario Analysis
Bullish Case
Trigger: BTC closes above $79,205 EMA20 with volume rising above 1.0x average
Target: $82,000
Invalidation: Daily close below $77,188
The bullish case depends on reclaiming short-term trend resistance while sentiment remains overly defensive at Fear & Greed 31. If buyers force price above the EMA20 with expanding participation, short covering from the 101,558 open contracts could accelerate upside momentum.
Base Case
Trigger: BTC holds between $77,188 support and $79,205 resistance with low volume continuation
Target: $77,000-$80,000 range
Invalidation: Volume expansion above 1.2x average combined with a breakout or breakdown
The base case favors sideways trading because RSI at 50.0 and the 0.98 long/short ratio show balanced positioning. Weak participation at 0.49x average volume suggests neither bulls nor bears currently have enough conviction to force trend continuation.
Bearish Case
Trigger: BTC loses $77,188 support with rising sell volume and negative MACD expansion
Target: $75,000
Invalidation: Daily reclaim above $79,205
The bearish case strengthens if support fails while market cap continues declining below $2.70T. Negative MACD momentum combined with weak risk appetite could push BTC below the EMA50 at $76,663 and trigger liquidation pressure across leveraged longs.
Bitcoin (BTC) Resources
Altcoin Overview
Among altcoins, BNB leads with the strongest bullish signal (score: 40), while AVAX shows the weakest setup (score: -35). Traders should focus on coins with clear directional signals and volume confirmation.
What to Watch
- BTC action around $78,436 for directional confirmation
- Fear & Greed at 31 for sentiment shift signals
- MACD crossover follow-through on top altcoins
- Volume confirmation on any support/resistance breaks
- BTC dominance at 58.3% for alt rotation signals


