BTC at $78,091 — Daily Crypto Technical Analysis (May 17, 2026)
BTC at $78,091 (bearish) with chart analysis, futures data, and scenario breakdown. ETH, SOL, and top altcoins analyzed.
Market Overview
The crypto market pulled back with total capitalization at $2.69T (-0.2%). BTC dominance sits at 58.2% while the Fear & Greed Index reads 27 (Fear), reflecting cautious sentiment.
Bitcoin (BTC) — $78,091
▼ WEAK BEARISH (Score: -20)
Price Action & Key Levels
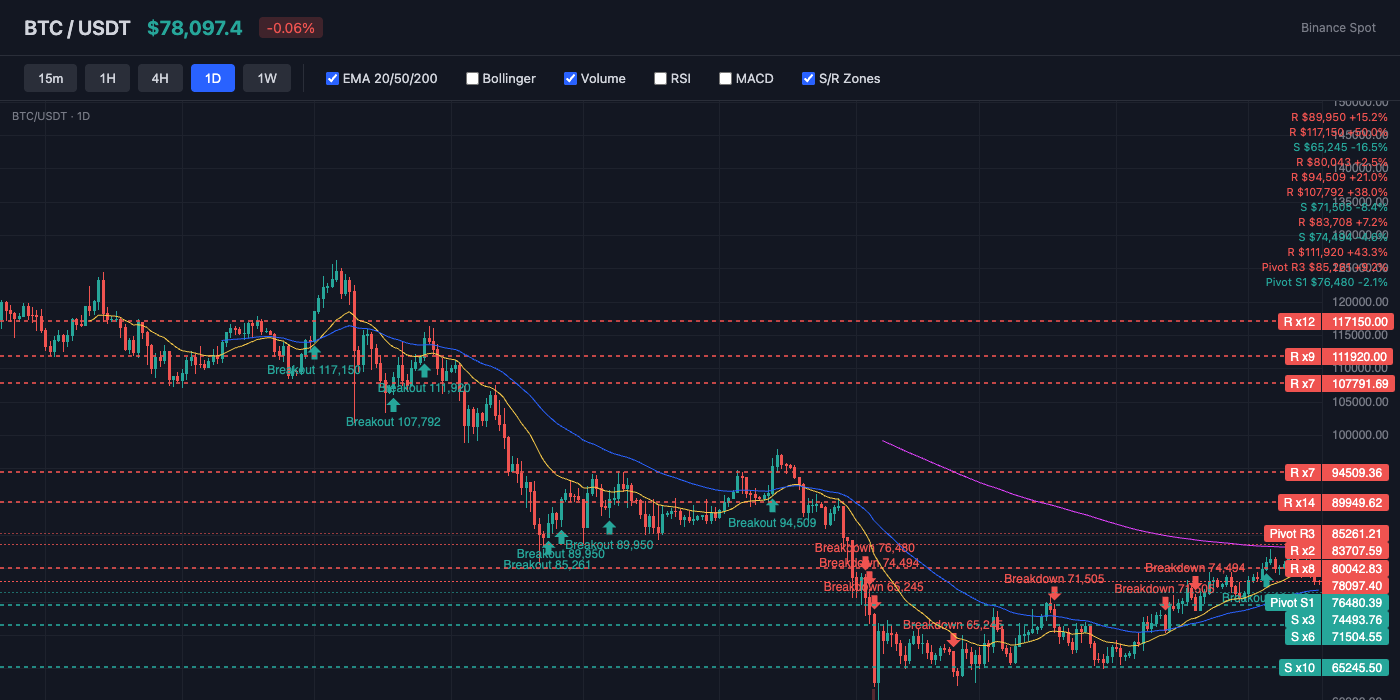
Bitcoin trades at $78,091, currently below the 20-day EMA ($79,048) and above the 50-day EMA ($76,711). The 200-day EMA at $84,212 serves as long-term resistance. Key resistance sits at $79,048 (EMA20), while support holds at $76,480 (Pivot S1). EMA alignment is mixed, suggesting a transitional or ranging market.
Bollinger Bands & Volatility
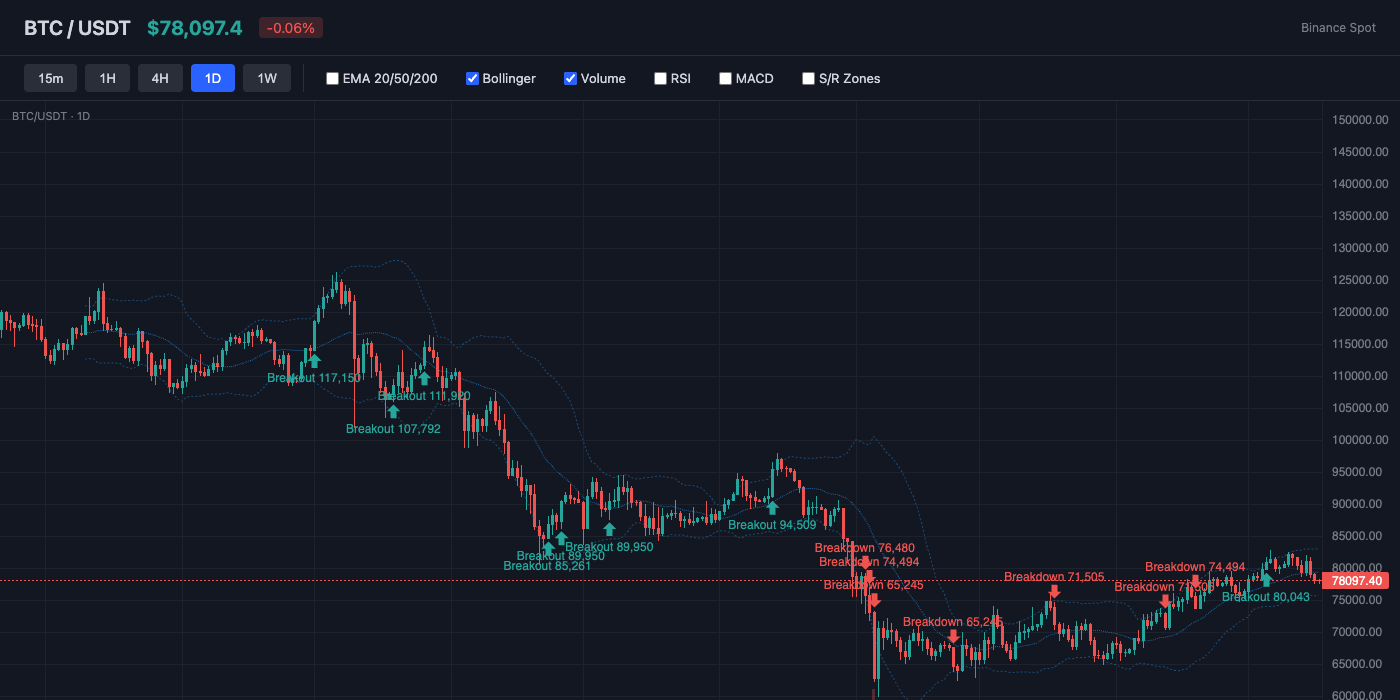
Bollinger Bands show a bandwidth of 8.9% (moderate volatility). Price is near the middle of the bands (%B: 32%), showing balanced positioning. The middle band (SMA 20) at $79,335 acts as dynamic resistance.
Momentum Indicators
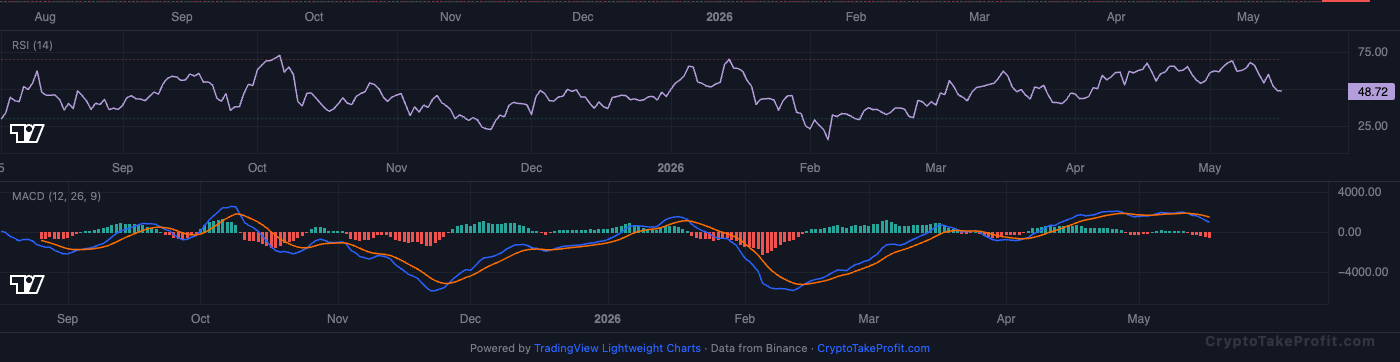
RSI reads 48.9, sitting in neutral range with no extreme readings. MACD has no active crossover, with negative histogram (-510.51) indicating downward pressure.
Market Structure
Price sits at 78 , 091 , 𝑡 𝑟 𝑎 𝑝 𝑝 𝑒 𝑑 𝑏 𝑒 𝑡 𝑤 𝑒 𝑒 𝑛 𝐸 𝑀 𝐴 20 ( 78,091,trappedbetweenEMA20(79,048) and pivot support ($76,480). RSI at 48.9 shows neutral momentum, but volume at 0.35x average confirms buyer absence. Per Coinglass data as of 14:00 UTC, funding rate at 0.0018% and 1.00 long/short ratio indicate extreme position equilibrium.
Volume Analysis
---MARKET_STRUCTURE--- Price sits at 78 , 091 , 𝑡 𝑟 𝑎 𝑝 𝑝 𝑒 𝑑 𝑏 𝑒 𝑡 𝑤 𝑒 𝑒 𝑛 𝐸 𝑀 𝐴 20 ( 78,091,trappedbetweenEMA20(79,048) and pivot support ($76,480). RSI at 48.9 shows neutral momentum, but volume at 0.35x average confirms buyer absence. Per Coinglass data as of 14:00 UTC, funding rate at 0.0018% and 1.00 long/short ratio indicate extreme position equilibrium. ---VOLUME---
Key Levels
| Price | Type | Source | Significance | Distance |
|---|---|---|---|---|
| $85,261 | Resistance | Pivot R3 | Low | +9.2% |
| $83,651 | Resistance | Pivot R2 | Medium | +7.1% |
| $80,871 | Resistance | Pivot R1 | Medium | +3.6% |
| $79,048 | Resistance | EMA20 | Low | +1.2% |
| $78,091 | Current | — | — | — |
| $76,480 | Support | Pivot S1 | Medium | -2.1% |
| $74,870 | Support | Pivot S2 | Medium | -4.1% |
| $72,090 | Support | Pivot S3 | Low | -7.7% |
Moving Averages
| MA | Value | Position | Signal |
|---|---|---|---|
| EMA 20 | $79,048 | Below | Bearish |
| EMA 50 | $76,711 | Above | Bullish |
| EMA 200 | $84,212 | Below | Bearish |
| BB Middle (SMA 20) | $79,335 | Below | Bearish |
Trade Setup
BTC Scenario Analysis
Bullish Case
Trigger: N/A
Target: N/A
Invalidation: N/A
Base Case
Trigger: N/A
Target: N/A
Invalidation: N/A
Bearish Case
Trigger: N/A
Target: N/A
Invalidation: N/A
Bitcoin (BTC) Resources
Altcoin Overview
Among altcoins, BNB leads with the strongest bullish signal (score: 40), while XRP shows the weakest setup (score: -30). Traders should focus on coins with clear directional signals and volume confirmation.
What to Watch
- BTC action around $78,091 for directional confirmation
- Fear & Greed at 27 for sentiment shift signals
- MACD crossover follow-through on top altcoins
- Volume confirmation on any support/resistance breaks
- BTC dominance at 58.2% for alt rotation signals


