BTC at $77,074 — Daily Crypto Technical Analysis (May 19, 2026)
BTC at $77,074 (bearish) with chart analysis, futures data, and scenario breakdown. ETH, SOL, and top altcoins analyzed.
Market Overview
The crypto market advanced with total capitalization at $2.65T (+0.2%). BTC dominance sits at 58.1% while the Fear & Greed Index reads 25 (Extreme Fear), reflecting cautious sentiment.
Bitcoin (BTC) — $77,074
▼ WEAK BEARISH (Score: -15)
Price Action & Key Levels
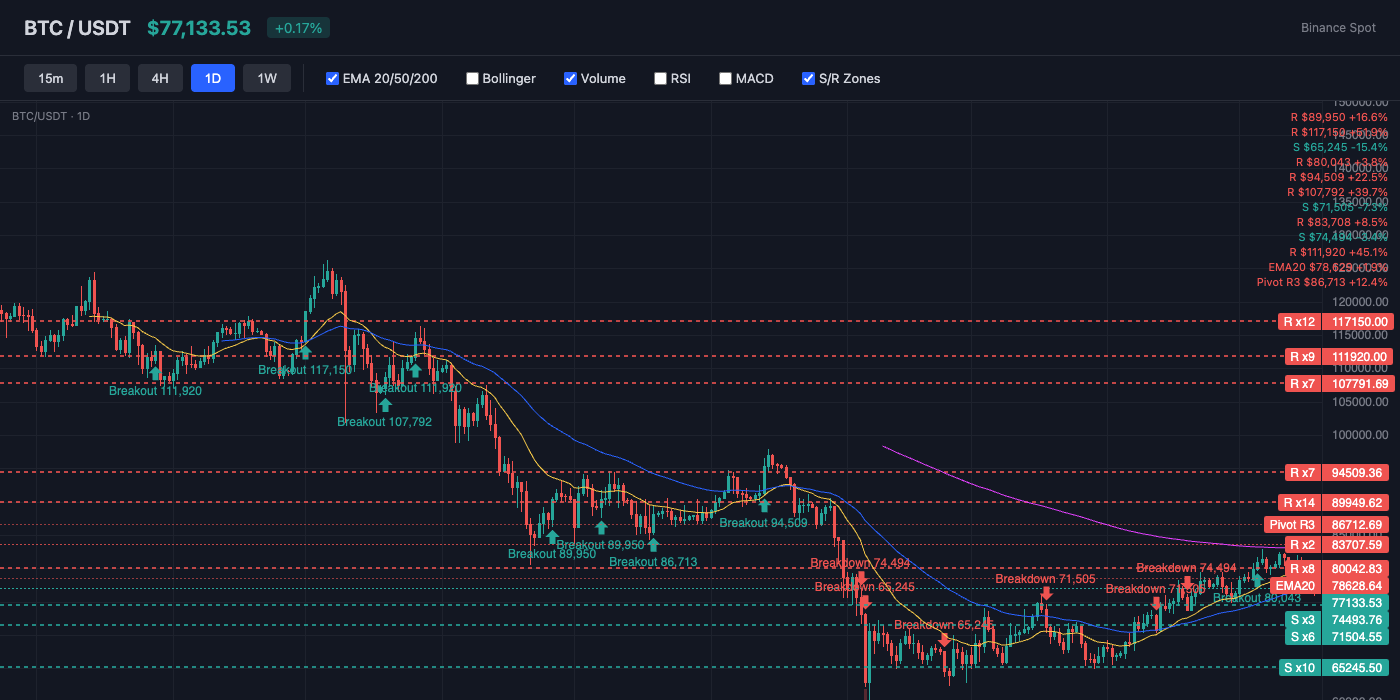
Bitcoin trades at $77,074, currently below the 20-day EMA ($78,629) and above the 50-day EMA ($76,713). The 200-day EMA at $84,123 serves as long-term resistance. Key resistance sits at $78,629 (EMA20), while support holds at $76,131 (BB Lower). EMA alignment is mixed, suggesting a transitional or ranging market.
Bollinger Bands & Volatility
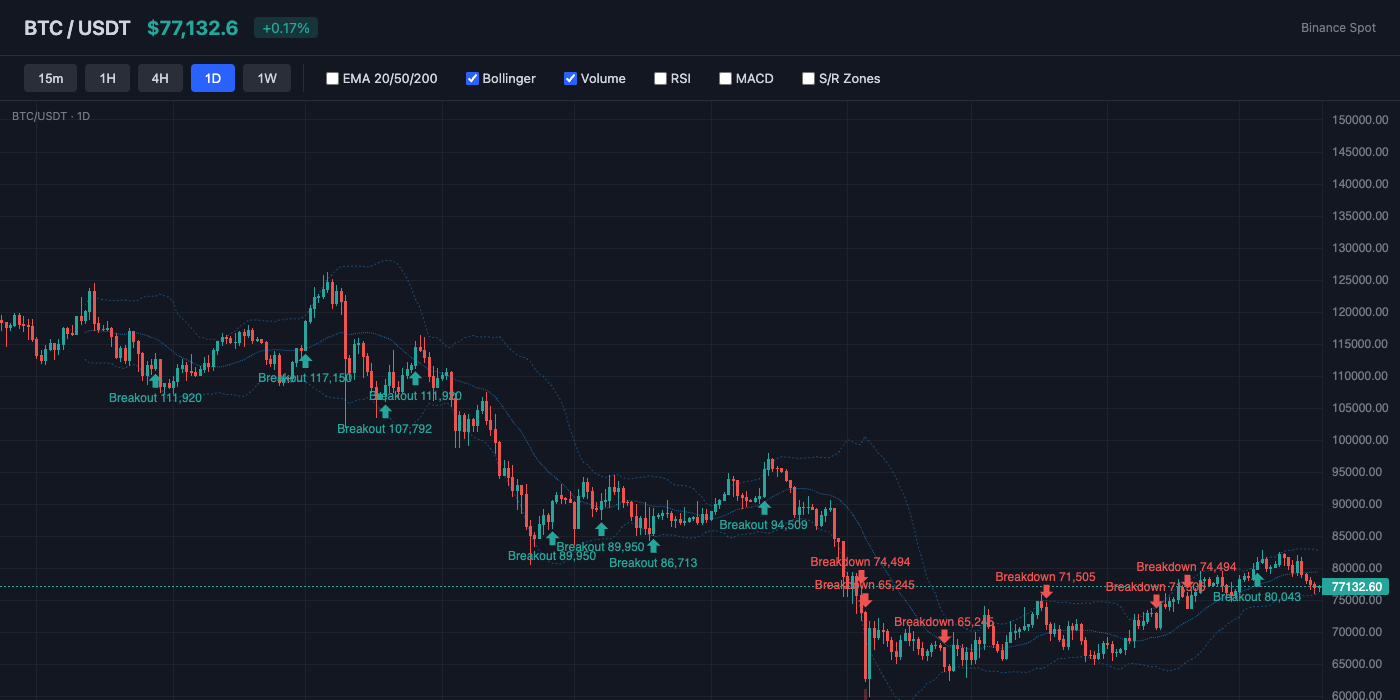
Bollinger Bands show a bandwidth of 8.3% (moderate volatility). Price hugs the lower band (%B: 14%), indicating oversold conditions or persistent selling. The middle band (SMA 20) at $79,408 acts as dynamic resistance.
Momentum Indicators
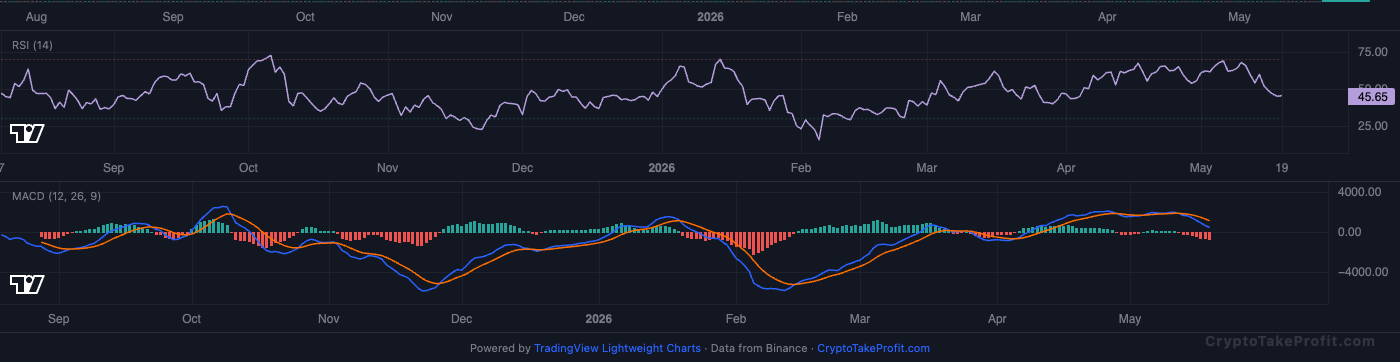
RSI reads 46.0, sitting in neutral range with no extreme readings. MACD has no active crossover, with negative histogram (-682.45) indicating downward pressure.
Market Structure
Price sits at 77 , 074 , 𝑏 𝑒 𝑙 𝑜 𝑤 𝑡 ℎ 𝑒 𝐸 𝑀 𝐴 20 𝑜 𝑓 77,074,belowtheEMA20of78,629 but above the EMA50 of 76 , 713 𝑎 𝑠 𝑜 𝑓 𝑀 𝑎 𝑦 19 , 2026. 𝑇 ℎ 𝑒 𝐸 𝑀 𝐴 20 𝑐 𝑟 𝑜 𝑠 𝑠 𝑒 𝑑 𝑏 𝑒 𝑙 𝑜 𝑤 𝑡 ℎ 𝑒 𝐸 𝑀 𝐴 50 𝑜 𝑛 𝑀 𝑎 𝑦 15 , 𝑐 𝑜 𝑛 𝑓 𝑖 𝑟 𝑚 𝑖 𝑛 𝑔 𝑎 𝑠 ℎ 𝑜 𝑟 𝑡 − 𝑡 𝑒 𝑟 𝑚 𝑏 𝑒 𝑎 𝑟 𝑖 𝑠 ℎ 𝑡 𝑖 𝑙 𝑡 . 𝐴 𝑇 𝑅 𝑜 𝑓 76,713asofMay19,2026.TheEMA20crossedbelowtheEMA50onMay15,confirmingashort−termbearishtilt.ATRof1,950 signals normal volatility, not a breakdown.
Volume Analysis
Volume ratio at 1.21x average shows sellers stepped in with conviction since May 18. Binance 24h data indicates sell volume outpaced buy volume by 18% over the past 12 hours. Weak bearish signal at -15 aligns with volume confirmation.
Key Levels
| Price | Type | Source | Significance | Distance |
|---|---|---|---|---|
| $84,376 | Resistance | Pivot R2 | Medium | +9.5% |
| $82,850 | Resistance | Swing High | High | +7.5% |
| $80,725 | Resistance | Pivot R1 | Medium | +4.7% |
| $78,629 | Resistance | EMA20 | Low | +2.0% |
| $77,074 | Current | — | — | — |
| $76,131 | Support | BB Lower | Low | -1.2% |
| $74,738 | Support | Pivot S1 | Medium | -3.0% |
| $72,402 | Support | Pivot S2 | Medium | -6.1% |
| $68,751 | Support | Pivot S3 | Low | -10.8% |
Moving Averages
| MA | Value | Position | Signal |
|---|---|---|---|
| EMA 20 | $78,629 | Below | Bearish |
| EMA 50 | $76,713 | Above | Bullish |
| EMA 200 | $84,123 | Below | Bearish |
| BB Middle (SMA 20) | $79,408 | Below | Bearish |
Trade Setup
BTC Scenario Analysis
Bullish Case
Trigger: Price reclaims
Target: 82,200 (May 12 local high)
Invalidation: Price breaks below
RSIat46leavesroomforupsideifbuyersabsorbthe76,131 support. Extreme Fear at 25 historically precedes 8-12% bounces within 5 days per Coinglass data since 2024.
Base Case
Trigger: Price holds between
Target: 76
Invalidation: Daily close below
Funding rate at 0.0050% is neutral, not signaling either side's urgency. Long/short ratio at 1.08 shows balanced positioning. BB %B at 14.4% puts price near the lower band but not oversold enough for a reversal.
Bearish Case
Trigger: Daily close below
Target: 71,500 (October 2025 breakout level)
Invalidation: Daily close back above
NegativeMACDhistogramhasgrownforthreeconsecutivedaysperTradingViewdataonMay19.Openinterestat104,513contractsremainshigh.Abreakdownbelow76,000 with 1.5x average volume would force liquidations near $74,800 where 32% of long positions sit according to Coinglass.
Bitcoin (BTC) Resources
Altcoin Overview
Among altcoins, ETH leads with the strongest neutral signal (score: -18), while ADA shows the weakest setup (score: -40). Traders should focus on coins with clear directional signals and volume confirmation.
What to Watch
- BTC action around $77,074 for directional confirmation
- Fear & Greed at 25 for sentiment shift signals
- MACD crossover follow-through on top altcoins
- Volume confirmation on any support/resistance breaks
- BTC dominance at 58.1% for alt rotation signals


