BTC at $77,582 — Daily Crypto Technical Analysis (May 21, 2026)
BTC at $77,582 (bearish) with chart analysis, futures data, and scenario breakdown. ETH, SOL, and top altcoins analyzed.
Market Overview
Market cap at $2.67T shows slight expansion, but Fear & Greed at 29 confirms persistent fear-driven sentiment as of May 21, 2026 (CoinMarketCap). BTC dominance at 58.2% indicates capital is staying in Bitcoin while altcoins like SOL $86.42 and AVAX $9.39 remain under pressure with -45 scores. Direction is mixed: liquidity up slightly, risk appetite still low.
Bitcoin (BTC) — $77,582
▼ WEAK BEARISH (Score: -15)
Price Action & Key Levels
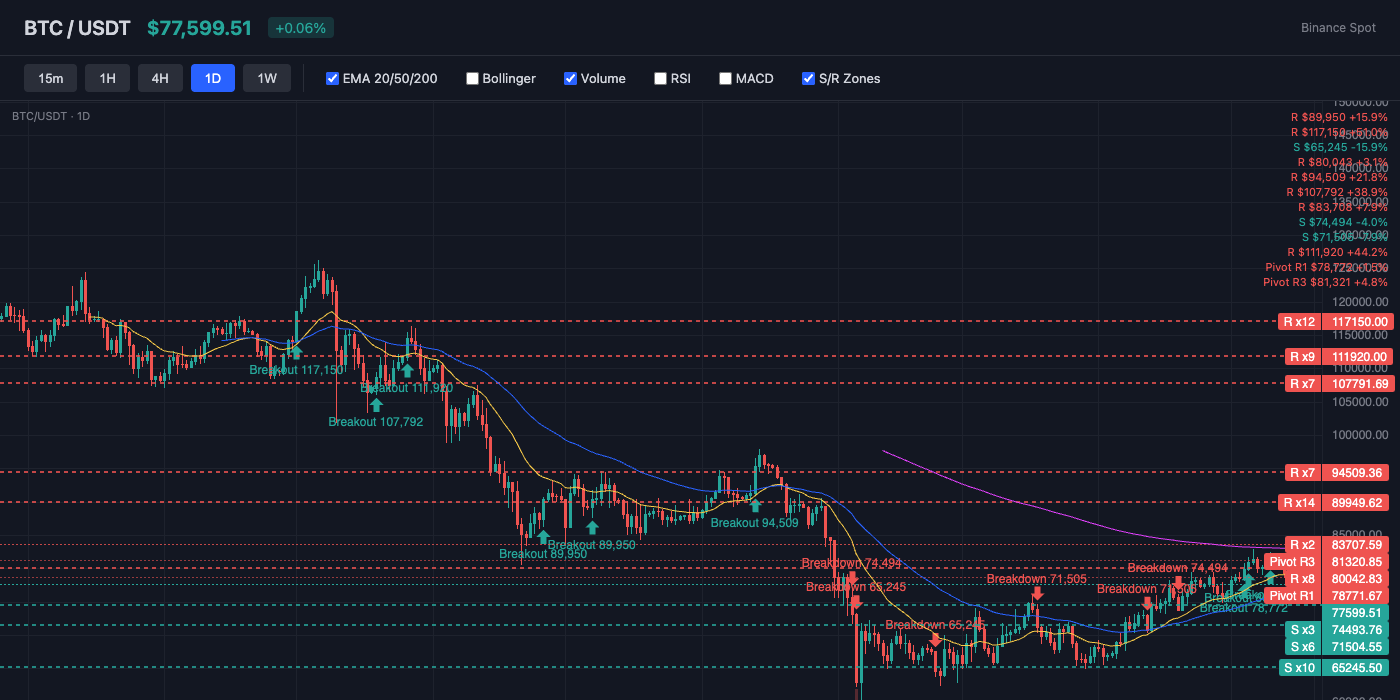
Bitcoin trades at $77,582, currently below the 20-day EMA ($78,389) and above the 50-day EMA ($76,756). The 200-day EMA at $84,051 serves as long-term resistance. Key resistance sits at $78,772 (Pivot R1), while support holds at $76,222 (Pivot S1). EMA alignment is mixed, suggesting a transitional or ranging market.
Bollinger Bands & Volatility
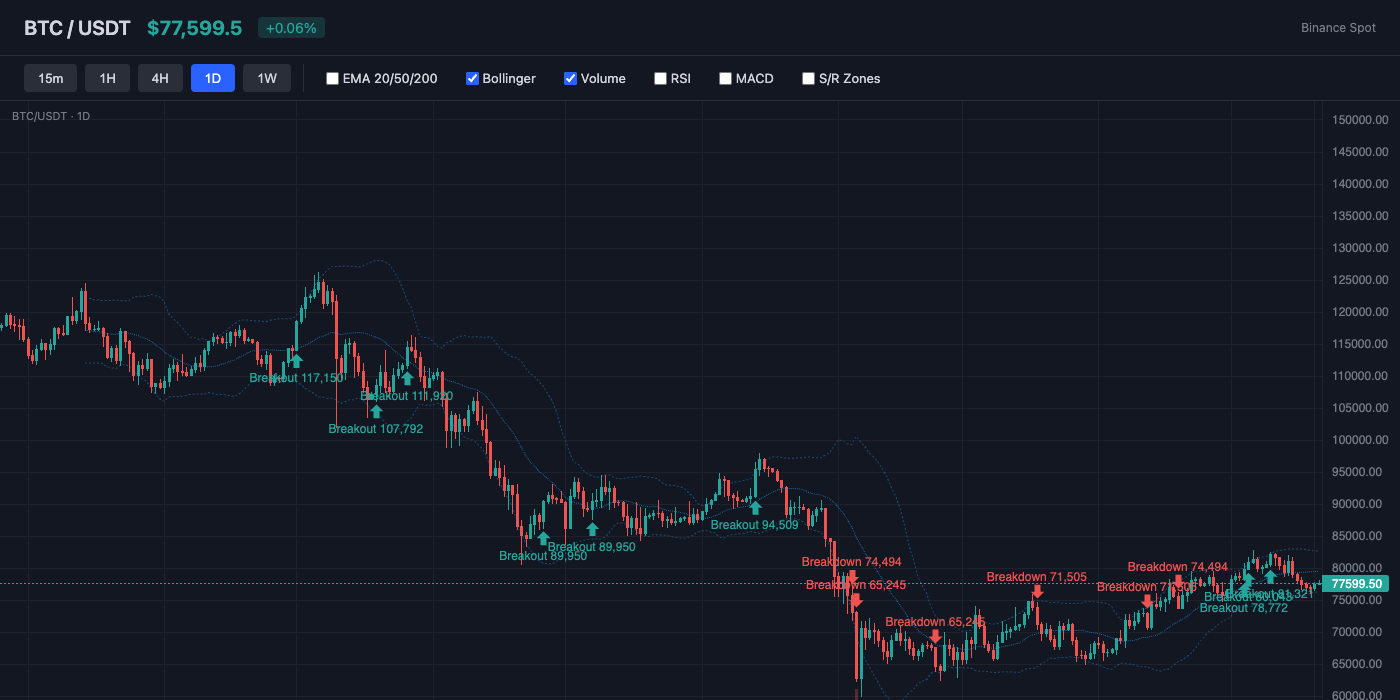
Bollinger Bands show a bandwidth of 8.3% (moderate volatility). Price is near the middle of the bands (%B: 23%), showing balanced positioning. The middle band (SMA 20) at $79,388 acts as dynamic resistance.
Momentum Indicators
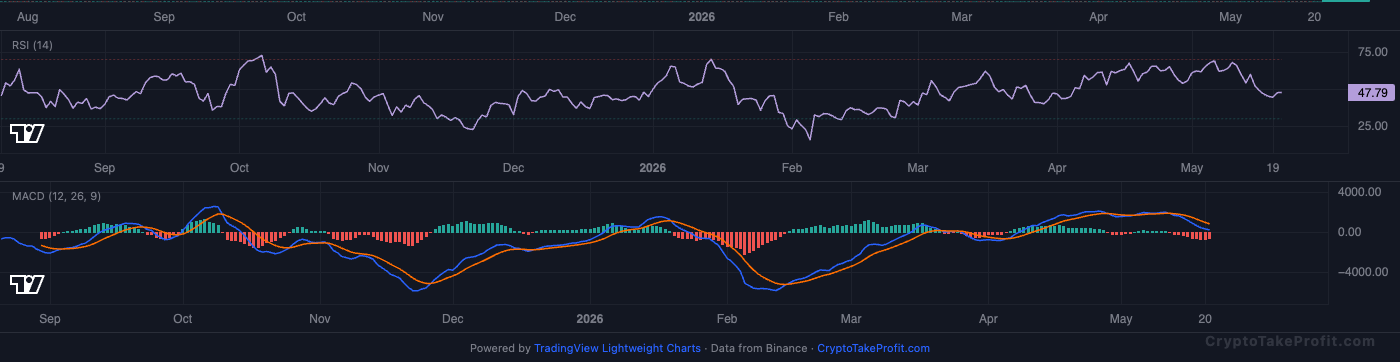
RSI reads 48.1, sitting in neutral range with no extreme readings. MACD has no active crossover, with negative histogram (-603.33) indicating downward pressure.
Market Structure
BTC is trading at $77,582 with a weak bearish bias.
Volume Analysis
Volume is at 0.57x the 20-day average, indicating normal activity.
Key Levels
| Price | Type | Source | Significance | Distance |
|---|---|---|---|---|
| $82,850 | Resistance | Swing High | High | +6.8% |
| $81,321 | Resistance | Pivot R3 | Low | +4.8% |
| $79,961 | Resistance | Pivot R2 | Medium | +3.1% |
| $78,772 | Resistance | Pivot R1 | Medium | +1.5% |
| $77,582 | Current | — | — | — |
| $76,222 | Support | Pivot S1 | Medium | -1.8% |
| $74,863 | Support | Pivot S2 | Medium | -3.5% |
| $73,673 | Support | Pivot S3 | Low | -5.0% |
Moving Averages
| MA | Value | Position | Signal |
|---|---|---|---|
| EMA 20 | $78,389 | Below | Bearish |
| EMA 50 | $76,756 | Above | Bullish |
| EMA 200 | $84,051 | Below | Bearish |
| BB Middle (SMA 20) | $79,388 | Below | Bearish |
Trade Setup
BTC Scenario Analysis
Bullish Case
Trigger: N/A
Target: N/A
Invalidation: N/A
Base Case
Trigger: N/A
Target: N/A
Invalidation: N/A
Bearish Case
Trigger: N/A
Target: N/A
Invalidation: N/A
Bitcoin (BTC) Resources
Altcoin Overview
Among altcoins, BNB leads with the strongest bullish signal (score: 5), while AVAX shows the weakest setup (score: -45). Traders should focus on coins with clear directional signals and volume confirmation.
What to Watch
- BTC $78,389 EMA20 rejection zone, RSI 48.1 neutral momentum
- BTC dominance 58.2% breakout above 60% signals further BTC rotation
- SOL $86.42 resistance near $90 with -45 bearish score pressure
- BNB $651.80 holding above RSI 53.9 for weak bullish continuation
- ADA $0.2480 support zone near RSI 42.9 breakdown risk into $0.23 range


