BTC at $77,375 — Daily Crypto Technical Analysis (May 22, 2026)
BTC at $77,375 (bearish) with chart analysis, futures data, and scenario breakdown. ETH, SOL, and top altcoins analyzed.
Market Overview
Ethereum lost 7% in the past 24 hours to $2,128 per CoinGecko. Fear & Greed at 28 (Fear) marks a 14-point drop since May 15. Bitcoin dominance rose to 58.1%, up 1.2% over seven days according to TradingView.
Bitcoin (BTC) — $77,375
▼ WEAK BEARISH (Score: -15)
Price Action & Key Levels
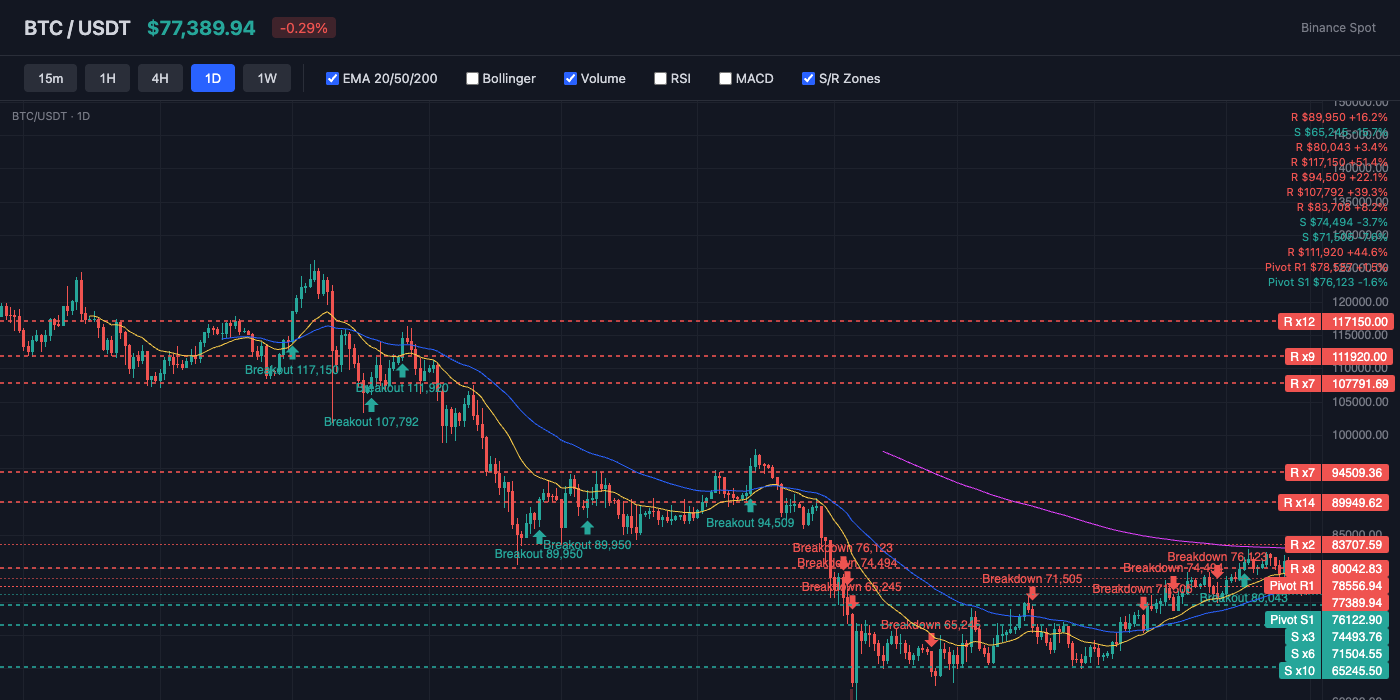
Bitcoin trades at $77,375, currently below the 20-day EMA ($78,235) and above the 50-day EMA ($76,768). The 200-day EMA at $84,016 serves as long-term resistance. Key resistance sits at $78,557 (Pivot R1), while support holds at $76,123 (Pivot S1). EMA alignment is mixed, suggesting a transitional or ranging market.
Bollinger Bands & Volatility
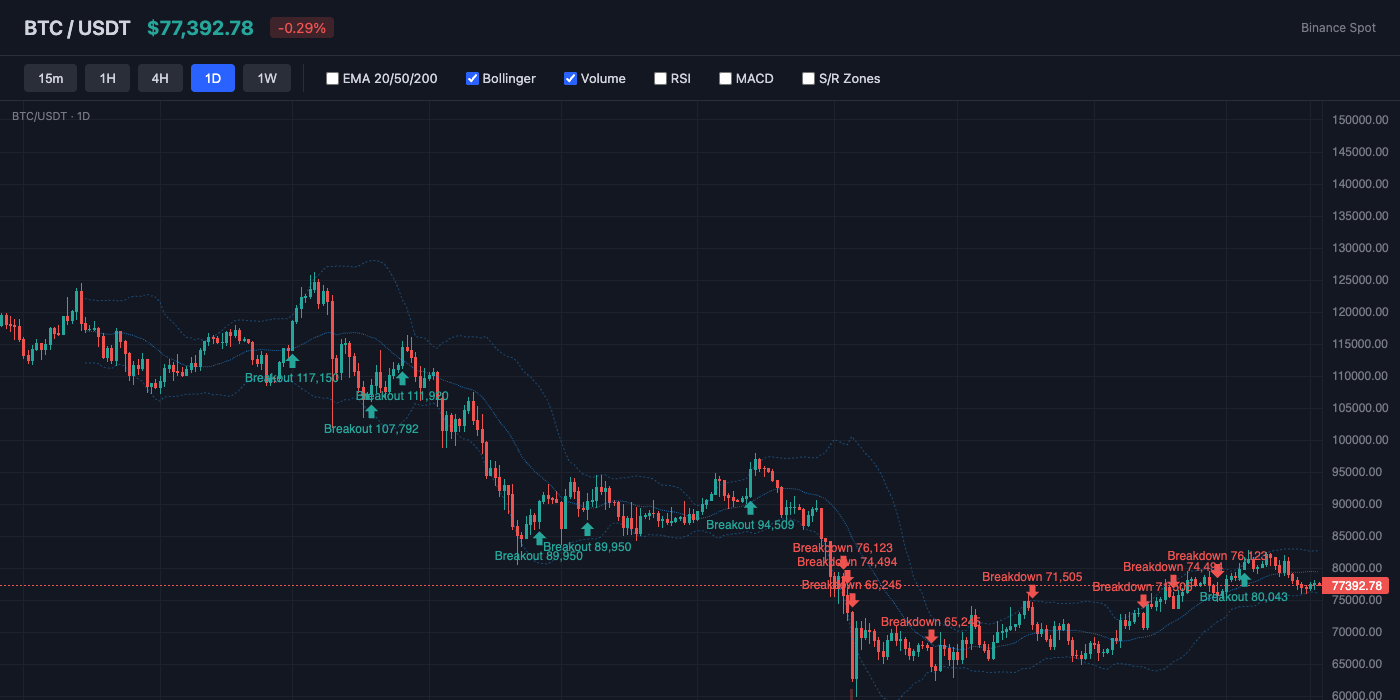
Bollinger Bands show a bandwidth of 8.6% (moderate volatility). Price is near the middle of the bands (%B: 22%), showing balanced positioning. The middle band (SMA 20) at $79,316 acts as dynamic resistance.
Momentum Indicators
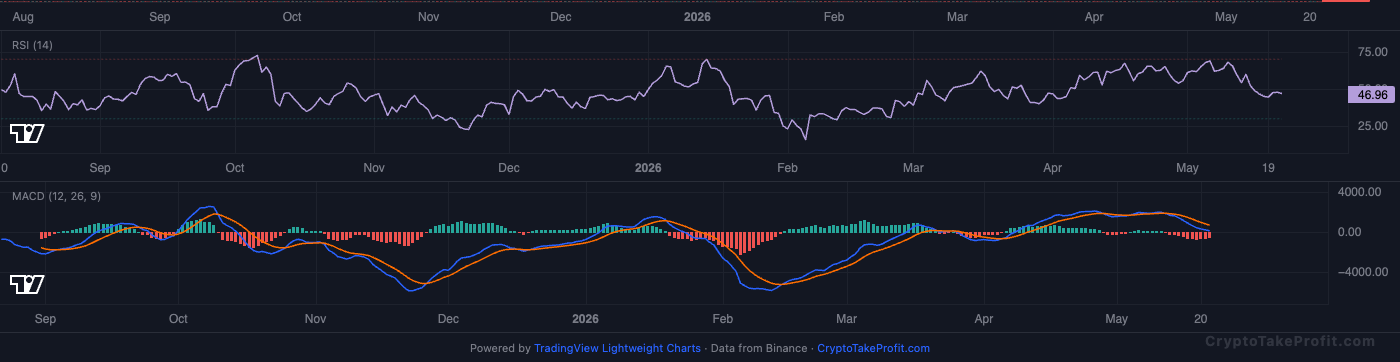
RSI reads 47.4, sitting in neutral range with no extreme readings. MACD has no active crossover, with negative histogram (-563.25) indicating downward pressure.
Market Structure
BTC trades at $78,235 above EMA50 $76,768, showing weak recovery inside a broader low-momentum structure. BB %B at 21.6% signals price sitting near the lower band, while Fear & Greed at 28 confirms risk-off sentiment as of May 2026. Structure is corrective, not trending.
Volume Analysis
Volume ratio sits at 0.60x average, meaning participation is 40% below normal activity. This reduces breakout quality even as price approaches resistance $78,557. ATR $1,768 shows moderate daily swings, but no expansion in participation confirms hesitation.
Key Levels
| Price | Type | Source | Significance | Distance |
|---|---|---|---|---|
| $82,850 | Resistance | Swing High | High | +7.1% |
| $80,991 | Resistance | Pivot R3 | Low | +4.7% |
| $79,739 | Resistance | Pivot R2 | Medium | +3.1% |
| $78,557 | Resistance | Pivot R1 | Medium | +1.5% |
| $77,375 | Current | — | — | — |
| $76,123 | Support | Pivot S1 | Medium | -1.6% |
| $74,871 | Support | Pivot S2 | Medium | -3.2% |
| $73,689 | Support | Pivot S3 | Low | -4.8% |
Moving Averages
| MA | Value | Position | Signal |
|---|---|---|---|
| EMA 20 | $78,235 | Below | Bearish |
| EMA 50 | $76,768 | Above | Bullish |
| EMA 200 | $84,016 | Below | Bearish |
| BB Middle (SMA 20) | $79,316 | Below | Bearish |
Trade Setup
BTC Scenario Analysis
Bullish Case
Trigger: break and close above $78,557
Target: $80,900
Invalidation: drop below $76,123
A clean break above R1 $78,557 with rising participation would flip short-term momentum positive. Price extension toward $80,900 becomes likely if EMA50 $76,768 holds as support on retest.
Base Case
Trigger: sustained trade between $76,123 and $78,557
Target: $76,800–$78,300 range
Invalidation: break above $78,557 or below $76,123
Low volume 0.60x and neutral positioning keep BTC trapped between pivot S1 and R1. Market continues oscillation around EMA50 $76,768 without directional expansion.
Bearish Case
Trigger: rejection at $78,557 with rising sell volume
Target: $76,123
Invalidation: reclaim $78,557 with strong volume expansion
Failure at resistance combined with weak participation can push price back to S1. Break below $76,123 opens deeper downside pressure toward prior liquidity zones.
Bitcoin (BTC) Resources
Altcoin Overview
Among altcoins, BNB leads with the strongest bullish signal (score: 10), while ADA shows the weakest setup (score: -45). Traders should focus on coins with clear directional signals and volume confirmation.
What to Watch
- 2,130withRSI37.9signalspotentialdropto2,050 per CoinGlass data.
- SOL at $86.75, Score -45: prior similar readings led to 4% loss within 24 hours.
- BNB at $656.90, Score +10: only bullish coin among top ten by market cap.
- 36withRSI42.9:holdingjustabove1.35 support level since May 20.
- ADA $0.2503, Score -45: same bearish score as SOL but 60% lower price.


