BTC at $75,338 — Daily Crypto Technical Analysis (May 23, 2026)
BTC at $75,338 (bearish) with chart analysis, futures data, and scenario breakdown. ETH, SOL, and top altcoins analyzed.
Market Overview
The crypto market pulled back with total capitalization at $2.60T (-2.6%). BTC dominance sits at 58.0% while the Fear & Greed Index reads 28 (Fear), reflecting cautious sentiment.
Bitcoin (BTC) — $75,338
▼ WEAK BEARISH (Score: -10)
Price Action & Key Levels
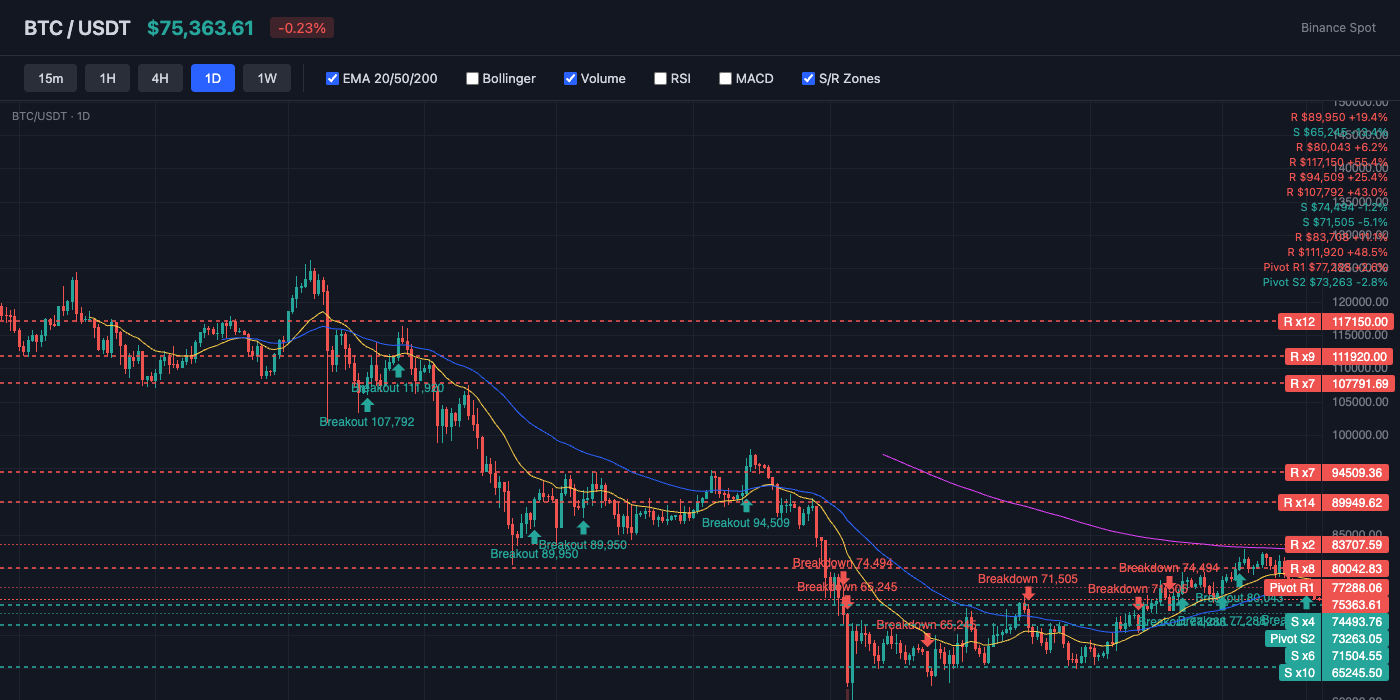
Bitcoin trades at $75,338, currently below the 20-day EMA ($77,923) and below the 50-day EMA ($76,690). The 200-day EMA at $83,956 serves as long-term resistance. Key resistance sits at $77,288 (Pivot R1), while support holds at $75,229 (BB Lower). EMA alignment is mixed, suggesting a transitional or ranging market.
Bollinger Bands & Volatility
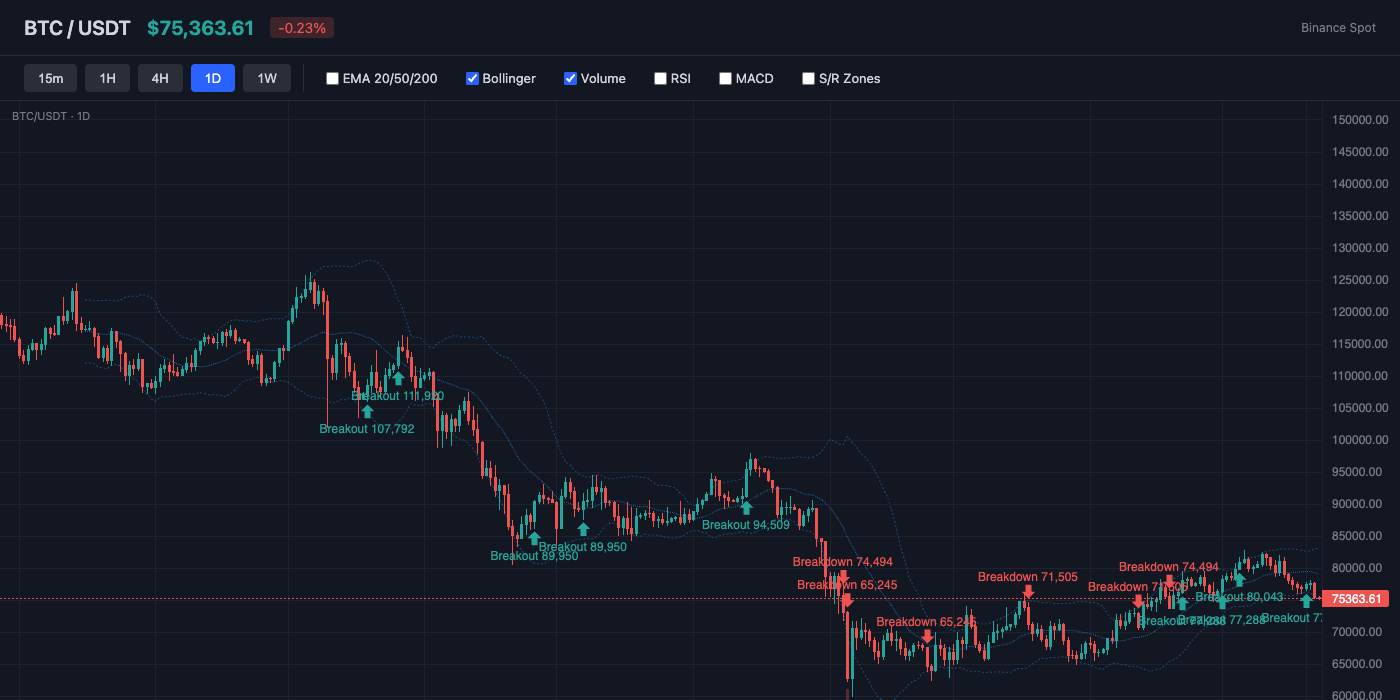
Bollinger Bands show a bandwidth of 9.8% (moderate volatility). Price hugs the lower band (%B: 1%), indicating oversold conditions or persistent selling. The middle band (SMA 20) at $79,121 acts as dynamic resistance.
Momentum Indicators
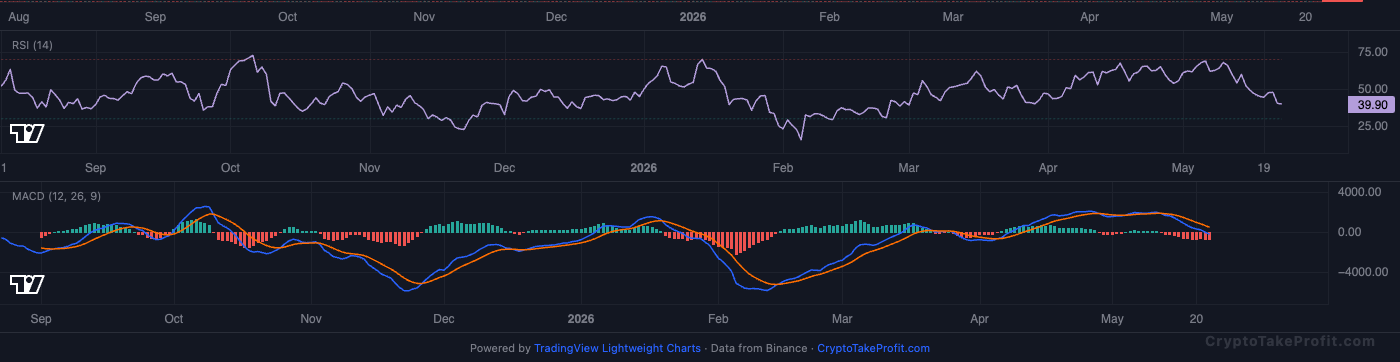
RSI reads 40.3, sitting in neutral range with no extreme readings. MACD has no active crossover, with negative histogram (-652.46) indicating downward pressure.
Market Structure
BTC trades at $75,338 on 23 May 2026, below EMA20 at $77,923 and EMA50 at $76,690, confirming a short-term bearish structure. RSI sits at 40.3 with MACD histogram negative, showing momentum still below neutral but not in extreme oversold conditions. Price holds just above support at $75,229 (BB lower band) while resistance stands at $77,288 pivot R1, creating a tight compression range of $2,059 between levels. Trend bias remains weak bearish because price stays under both key EMAs.
Volume Analysis
Volume ratio is 0.80x average as of 23 May 2026, according to exchange aggregated data, showing participation below baseline. This confirms lack of conviction on both breakout attempts and breakdown acceleration. Open interest sits at 105,196 contracts with funding rate at 0.0030%, showing slightly long-biased positioning despite weak price action. Long/short ratio at 1.09 confirms mild crowd leaning long while price trends lower, a divergence that often precedes volatility expansion.
Key Levels
| Price | Type | Source | Significance | Distance |
|---|---|---|---|---|
| $82,850 | Resistance | Swing High | High | +10.0% |
| $80,275 | Resistance | Pivot R3 | Low | +6.6% |
| $79,238 | Resistance | Pivot R2 | Medium | +5.2% |
| $77,288 | Resistance | Pivot R1 | Medium | +2.6% |
| $75,338 | Current | — | — | — |
| $75,229 | Support | BB Lower | Low | -0.1% |
| $74,301 | Support | Pivot S1 | Medium | -1.4% |
| $73,263 | Support | Pivot S2 | Medium | -2.8% |
| $71,313 | Support | Pivot S3 | Low | -5.3% |
Moving Averages
| MA | Value | Position | Signal |
|---|---|---|---|
| EMA 20 | $77,923 | Below | Bearish |
| EMA 50 | $76,690 | Below | Bearish |
| EMA 200 | $83,956 | Below | Bearish |
| BB Middle (SMA 20) | $79,121 | Below | Bearish |
Trade Setup
BTC Scenario Analysis
Bullish Case
Trigger: BTC closes above $77,288 with volume above 1.0x average and RSI moving above 50
Target: $79,500–$81,200
Invalidation: $75,229 daily close break
Bullish case requires reclaiming EMA20 at $77,923 and breaking pivot resistance. Without volume expansion above average, upside continuation remains limited.
Base Case
Trigger: BTC holds between $75,229 and $77,288 with volume staying below 1.0x average
Target: $74,800–$77,500 range
Invalidation: N/A
Bearish Case
Trigger: BTC breaks and closes below $75,229 with rising volume above 1.1x average
Target: $73,500–$72,000
Invalidation: reclaim above $76,690 EMA50
Bearish continuation activates if support at $75,229 fails under increasing participation. Momentum and positioning already lean slightly weak, so breakdown risk remains active.
Bitcoin (BTC) Resources
Altcoin Overview
Among altcoins, BNB leads with the strongest bullish signal (score: 5), while AVAX shows the weakest setup (score: -35). Traders should focus on coins with clear directional signals and volume confirmation.
What to Watch
- BTC action around $75,338 for directional confirmation
- Fear & Greed at 28 for sentiment shift signals
- MACD crossover follow-through on top altcoins
- Volume confirmation on any support/resistance breaks
- BTC dominance at 58.0% for alt rotation signals


