BTC at $75,896 — Daily Crypto Technical Analysis (May 27, 2026)
Market Overview
The crypto market pulled back with total capitalization at $2.62T (-0.6%). BTC dominance sits at 58.0% while the Fear & Greed Index reads 25 (Extreme Fear), reflecting cautious sentiment.
Bitcoin (BTC) — $75,896
▼ WEAK BEARISH (Score: -15)
Price Action & Key Levels
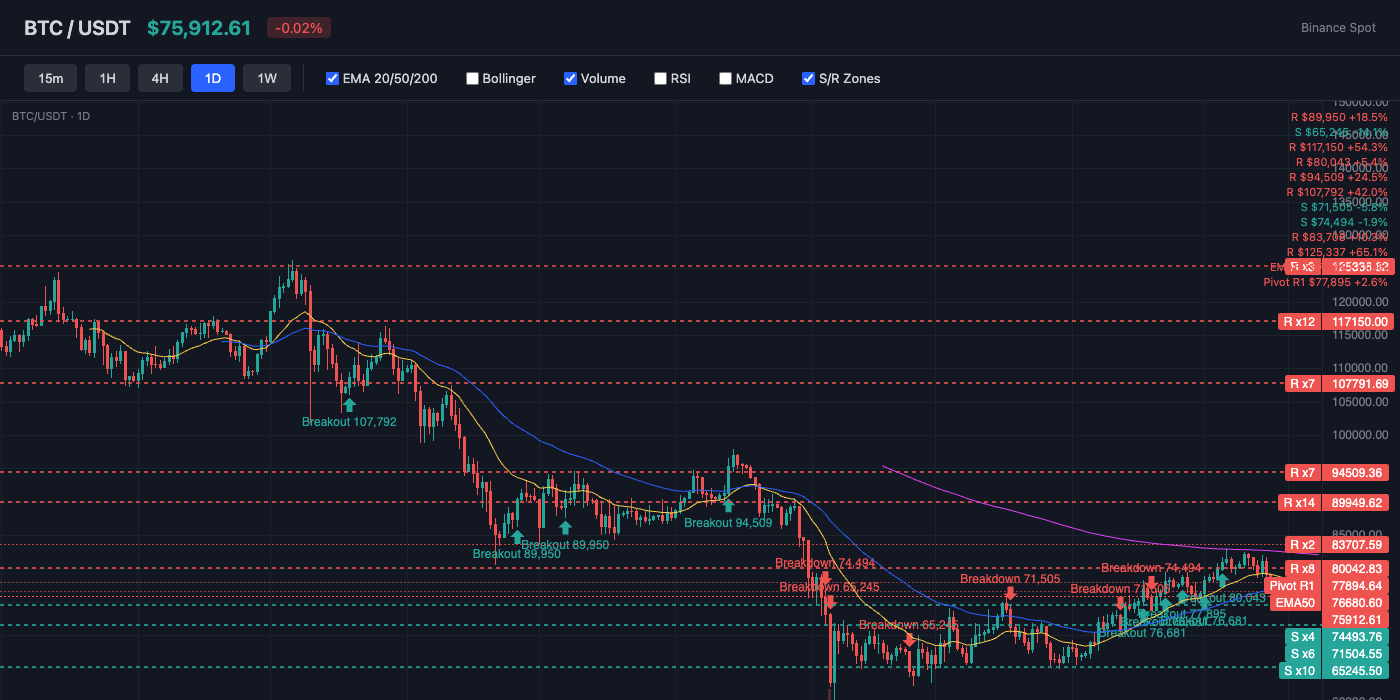
Bitcoin trades at $75,896, currently below the 20-day EMA ($77,601) and below the 50-day EMA ($76,681). The 200-day EMA at $83,778 serves as long-term resistance. Key resistance sits at $76,681 (EMA50), while support holds at $74,082 (Pivot S1). EMA alignment is mixed, suggesting a transitional or ranging market.
Bollinger Bands & Volatility
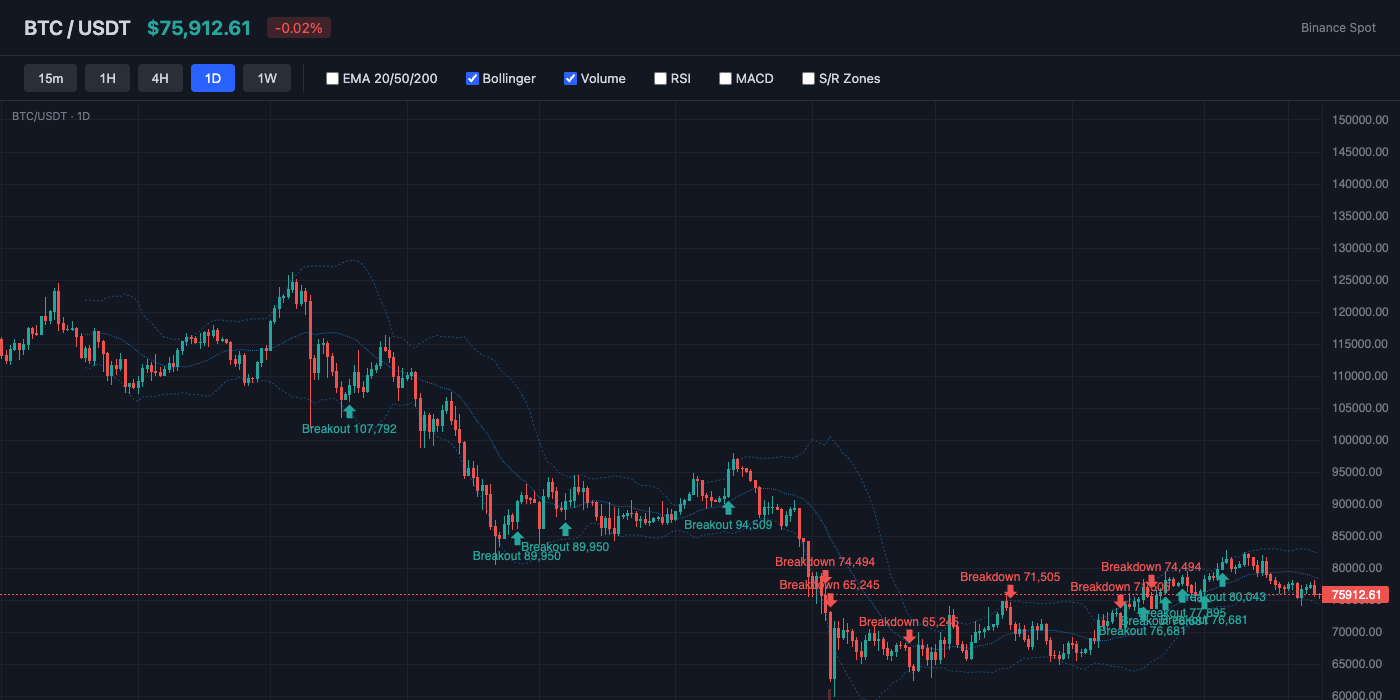
Bollinger Bands show a bandwidth of 9.8% (moderate volatility). Price hugs the lower band (%B: 19%), indicating oversold conditions or persistent selling. The middle band (SMA 20) at $78,291 acts as dynamic resistance.
Momentum Indicators
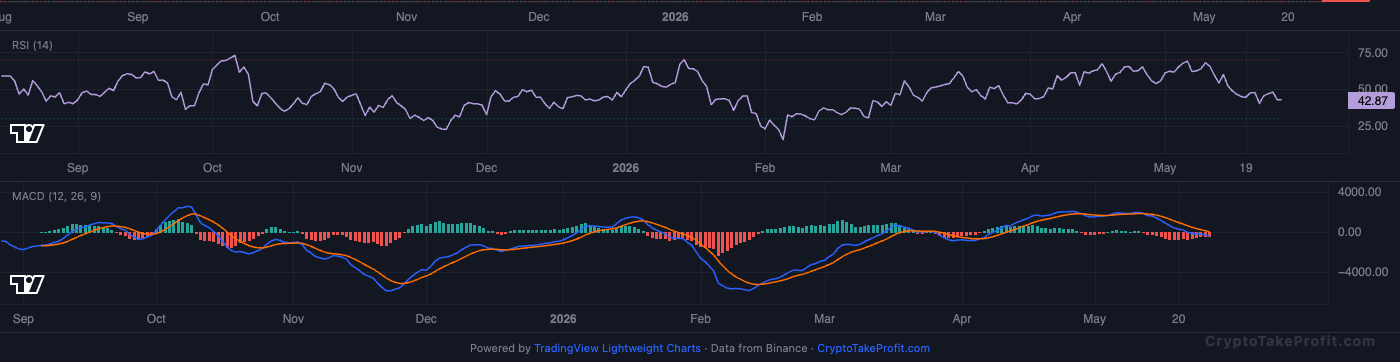
RSI reads 43.7, sitting in neutral range with no extreme readings. MACD has no active crossover, with negative histogram (-393.06) indicating downward pressure.
Market Structure
Price at 75 , 896 𝑠 𝑖 𝑡 𝑠 𝑏 𝑒 𝑙 𝑜 𝑤 𝑏 𝑜 𝑡 ℎ 𝑡 ℎ 𝑒 𝐸 𝑀 𝐴 20 ( 75,896sitsbelowboththeEMA20(77,601) and EMA50 ($76,681) as of May 27, 2026. MACD histogram is negative with no line crossover, confirming bearish momentum. RSI at 43.7 is neutral-bearish, above oversold but below 50.
Volume Analysis
Volume ratio at 0.85x average shows weaker participation than the past 14 days, per exchange data. Low volume on the current downward move suggests lack of aggressive selling, but also no buying conviction.
Key Levels
| Price | Type | Source | Significance | Distance |
|---|---|---|---|---|
| $81,707 | Resistance | Pivot R3 | Low | +7.7% |
| $79,893 | Resistance | Pivot R2 | Medium | +5.3% |
| $77,895 | Resistance | Pivot R1 | Medium | +2.6% |
| $76,681 | Resistance | EMA50 | Medium | +1.0% |
| $75,896 | Current | — | — | — |
| $74,082 | Support | Pivot S1 | Medium | -2.4% |
| $72,269 | Support | Pivot S2 | Medium | -4.8% |
| $70,270 | Support | Pivot S3 | Low | -7.4% |
Moving Averages
| MA | Value | Position | Signal |
|---|---|---|---|
| EMA 20 | $77,601 | Below | Bearish |
| EMA 50 | $76,681 | Below | Bearish |
| EMA 200 | $83,778 | Below | Bearish |
| BB Middle (SMA 20) | $78,291 | Below | Bearish |
Trade Setup
BTC Scenario Analysis
Bullish Case
Trigger: Price reclaims EMA50 at
Target: 80,200 (pivot R2)
Invalidation: Price breaks below support at
Long/Shortratioat1.31meansfuturestradersarealreadynetlong.Areclaimof76,681 would trap late shorts and squeeze funding rate above 0.01%.
Base Case
Trigger: Price holds above
Target: 74
Invalidation: Daily close below
Fear & Greed at 25 (Extreme Fear) typically precedes sideways consolidation, not crashes. Open Interest at 101,005 contracts is flat over past 24 hours, indicating no directional conviction from leveraged traders.
Bearish Case
Trigger: Daily close below pivot S1 at
Target: 71,600 (ATR-based extension of
Invalidation: Pricereclaims75,896 within 24 hours after the close
BB %B at 18.8% places price in the lower Bollinger bandwidth but not oversold. ATR at 1
Bitcoin (BTC) Resources
Altcoin Overview
Among altcoins, BNB leads with the strongest bullish signal (score: 2), while AVAX shows the weakest setup (score: -35). Traders should focus on coins with clear directional signals and volume confirmation.
What to Watch
- BTC action around $75,896 for directional confirmation
- Fear & Greed at 25 for sentiment shift signals
- MACD crossover follow-through on top altcoins
- Volume confirmation on any support/resistance breaks
- BTC dominance at 58.0% for alt rotation signals