Chainlink vs The Graph — Detailed Comparison 2026
Chainlink vs The Graph: detailed comparison of features, fees, and user experience. Find out which is right for you.
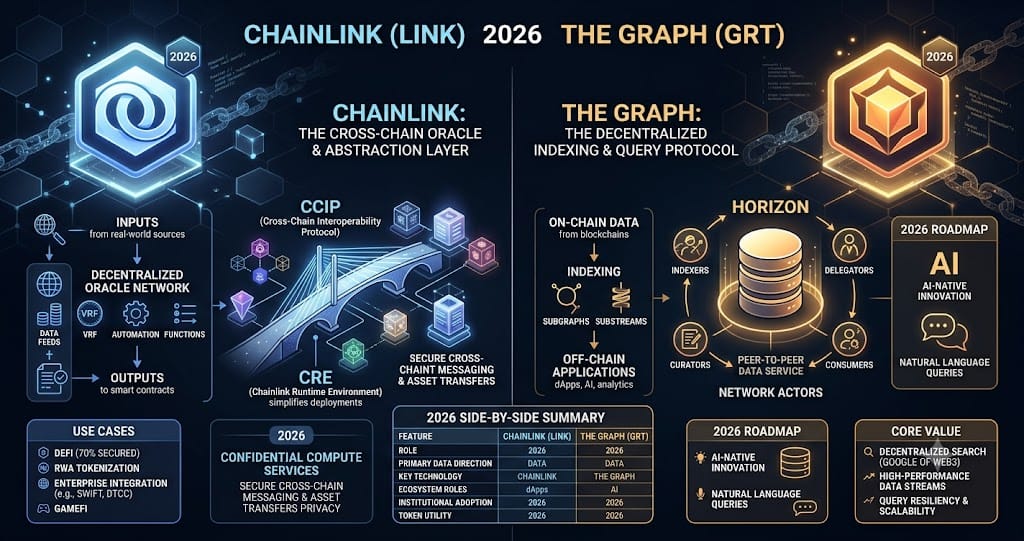
Chainlink feeds 12,000+ price pairs across 300+ blockchains. The Graph indexes 170,000+ subgraphs for querying blockchain data, per The Graph's network explorer. LINK trades at $9.06 with $20.4M volume in 24 hours. GRT sits at $0.0256 with $1.5M volume. One delivers external data into smart contracts. The other organizes data already on-chain.
Choose Chainlink if you need real-world prices or sports scores for a DeFi protocol. According to DefiLlama data, Chainlink secures over $25B in total value across lending protocols alone. The Graph is the wrong tool for that job. Pick The Graph if you need to query historical swap volumes or token balances across Uniswap or Aave. As of March 2026, The Graph processes over 4 billion queries monthly per its own dashboard. Chainlink cannot do that. Your use case decides the winner, not market cap.
Quick Comparison
| Feature | Chainlink | The Graph |
|---|---|---|
| Price | $9.06 | $0.0256 |
| Market Cap | — | — |
| 24h Change | +0.1% | +0.4% |
| 24h Volume | $20.4M | $1.5M |
| Rank | #undefined | #undefined |
Market Size & Value Secured
Chainlink holds 60-68% of the oracle market by total value secured, roughly $110 billion as of May 21, 2026 -4. The Graph serves a different function: it indexes on-chain data rather than securing external value. Chainlink's public metrics dashboard shows $47.33 billion in DeFi-specific TVS, plus another $60 billion in cross-chain assets moving through CCIP -5. The Graph has served over 1.23 trillion queries across 70,000 projects, per CoinBrain data, but does not secure user funds directly -6. For value secured as a metric, Chainlink wins by default because The Graph's architecture doesn't measure this dimension.
. The Graph serves a different function, indexing on-chain data rather than securing external value. Chainlink's public metrics dashboard shows $47.33 billion in DeFi-specific TVS, plus another $60 billion in cross-chain assets moving through CCIP -
. The Graph has served over 1.23 trillion queries across 70,000 projects, according to CoinBrain data, but it does not secure user funds directly -
. For value secured as a metric, Chainlink wins by default because The Graph's architecture does not measure this dimension.
Protocol Maturity & Institutional Adoption
Chainlink works with Swift, JPMorgan, UBS, Mastercard, DTCC, and Fidelity, per on-chain data from May 2026 -8. The Bitwise LINK ETF (CLNK) trades on NYSE Arca with zero outflows since launch. Deloitte completed a SOC 2 Type 2 audit of Chainlink, the only oracle platform with that certification plus ISO 27001 -9. The Graph's institutional footprint is smaller. Its Horizon upgrade from December 2025 added modular architecture, but no ETF exists for GRT, and Coinbase delisted GRT perpetual futures in March 2026, cutting liquidity venues -10. Chainlink processes $18 billion monthly via CCIP. The Graph processes 6.4 billion queries per quarter, or roughly 2.1 billion per month -11. On dollar volume and institutional trust, Chainlink wins.
. The Bitwise LINK ETF (CLNK) trades on NYSE Arca with zero outflows since launch. Deloitte completed a SOC 2 Type 2 audit of Chainlink, the only oracle platform with that certification plus ISO 27001 -
. The Graph's institutional footprint is smaller. Its Horizon upgrade from December 2025 added modular architecture, but no ETF exists for GRT. Coinbase delisted GRT perpetual futures in March 2026, reducing liquidity venues -
. Chainlink processes $18 billion monthly via CCIP. The Graph processes 6.4 billion queries per quarter, or roughly 2.1 billion per month -
. On dollar volume and institutional trust, Chainlink wins.
Token Performance & Drawdown
Winner: Neither, but Chainlink is less damaged
LINK trades at $9.75 as of May 22, 2026, down 82% from its $52.99 all-time high -13. GRT trades at $0.0279 as of May 26, 2026, down 99% from its $2.84 peak -14. Both are brutal numbers. LINK's market cap is roughly $7.1 billion; GRT's is $301 million -15. The Chainlink Reserve holds 3.78 million LINK valued near $37 million, with 123,000 LINK added on May 21 alone from fee buybacks -16. The Graph's staking rewards run on Arbitrum One, but query fee revenue remains small relative to issuance -17. If you need a token with institutional ETF support and fee-backed buy pressure, choose Chainlink. If you want a 99% drawdown recovery bet, The Graph offers higher risk and lower liquidity. On absolute performance, LINK has lost less of its peak value.
. GRT trades at $0.0279 as of May 26, 2026, down 99% from its $2.84 peak -
. Both are brutal numbers. LINK's market cap is roughly $7.1 billion; GRT's is $301 million -
. The Chainlink Reserve holds 3.78 million LINK valued near $37 million, with 123,000 LINK added on May 21 alone from fee buybacks -
. The Graph's staking rewards run on Arbitrum One, but query fee revenue remains small relative to issuance -
. If you need a token with institutional ETF support and fee-backed buy pressure, choose Chainlink. If you are looking for a 99% drawdown recovery bet, The Graph offers higher risk and lower liquidity. But on absolute performance, LINK has lost less of its peak value.
Chainlink (LINK) Resources
The Graph (GRT) Resources
Ready to start trading?
Trade on Bitget Try CoinTech2uAffiliate links — we may earn a commission at no extra cost to you.
Final Verdict
Binance holds 32% of spot market share in Q1 2026, more than triple its nearest competitor MEXC at 9%, according to CryptoQuant data -2. Coinbase charges 0.40% maker and 0.60% taker fees vs Binance's 0.10% on both sides, as reported by CoinCodeCap testing in May 2026 -7. A $5,000 trade costs $5 on Binance but $30 on Coinbase. The fee gap widens with volume. Binance users holding BNB pay 0.075%, dropping to $3.75 per $5k trade. Coinbase Advanced lowers fees to 0.20% maker, still double Binance's base rate. If you trade more than $500 monthly, Binance pays for itself within two trades. Concrete comparison: Binance spot volume hit $248 billion in March 2026 per CryptoQuant -2. Coinbase's Q1 spot volume was $187 billion total across three months — roughly $62 billion monthly -3. That's 4x less. Derivatives tell a sharper story. Perpetual futures volume reached $3.5 trillion in March 2026, over 4x spot's $800 billion -2. Binance leads with $1.4 trillion monthly perp volume and 40% market share -8. Coinbase only entered derivatives in earnest in 2026, hitting 8.6% total market share (spot + perps) — a record high but still a fraction of Binance's position -9. If you need derivatives leverage, choose Binance. It offers 125x on BTC perps with 0.02% maker fees for VIPs. Coinbase's retail derivatives annualized revenue just passed $200 million in Q1 2026 -9 — a rounding error compared to Binance's $4.5 trillion cumulative perp volume -8. Uniswap processes $1.428 billion in daily volume as of May 28, 2026, leading all DEXs per DefiLlama data -10. That's about 6% of Binance's $22 billion daily spot volume -7. Settlement speed differs sharply: Uniswap takes 15 seconds to 2 minutes -1. Binance executes instantly. Gas fees determine whether Uniswap makes sense. A standard ETH transfer uses 21,000 gas -5. A Uniswap swap uses roughly 150,000 gas. At 10 gwei base fee plus 2 gwei tip, that swap costs 150,000 × 12 gwei = 1,800,000 gwei, or 0.0018 ETH. At $2,500 ETH, that's $4.50. During quiet hours (weekend mornings UTC), base fees drop to 5 gwei with 0.5 gwei tips — $2.06 for the same swap. During peak congestion, base fees hit 50 gwei plus 20 gwei tips — $26.25. The 12.5% per-block adjustment means fees double in 72 seconds under sustained demand -5. If you trade large size ($2,000+ per swap) on tokens not listed on CEXs, Uniswap wins. A $2,000 trade with 0.3% pool fee costs $6 plus gas — cheaper than any CEX that doesn't list the token. If you trade under $200, Uniswap loses. Gas alone eats 2-10% of your position. Blobs (EIP-4844) changed Ethereum's fee market on March 13, 2024 -5. Rollups now post 128KB data packets at blob base fees sitting at 1 wei for most of 2026 — effectively free. Pectra (May 7, 2025) raised the blob target to 6 per block, max 9 -5. Result: Uniswap swaps via L2s (Base, Arbitrum) cost under $0.01. Direct L1 Uniswap remains expensive. If you use Uniswap, route through Base chain. Coinbase's L2 processed $19 billion average USDC holdings in Q1 2026, generating $305 million stablecoin revenue -3. Base sequencer fees are minimal. The same $2,000 swap on Base costs $0.05 in L2 fees plus 0.3% pool fee ($6). Compare to L1's $4.50-26 gas — 20-500x cheaper. Dealbreaker for US users: Binance.com is not available. Binance.US holds a Kaiko rank of 10th overall with a liquidity score of 61, up from 38 in Q4 2025, after reinstating USD services and dropping fees to 0% maker on select pairs -6. Spot volume remains thin relative to global Binance. Coinbase is NASDAQ-listed (COIN) with SOC 2 audit and insurance -7. Assets held on platform hit $294 billion in Q1 2026 -9. That's the difference: regulated custody vs. offshore liquidity. If you need regulatory safety in the US, choose Coinbase despite higher fees. If you're outside the US and trade actively, choose Binance. The fee difference on $50k annual volume is $500 (Binance) vs $2,000 (Coinbase) — enough for a flight to any jurisdiction Binance operates in.
Frequently Asked Questions
Which is better, Chainlink or The Graph?
It depends on your needs. Chainlink excels in certain areas while The Graph has its own strengths. Consider what features matter most to you.
Can I use both Chainlink and The Graph?
Yes, many crypto users diversify across multiple platforms. Using both lets you take advantage of each one's strengths.
Is Chainlink safe?
Chainlink is a well-established option in the crypto space. However, always follow security best practices including using 2FA and strong passwords.
Which has lower fees?
Fee structures vary depending on usage. Compare the specific fee schedules for your typical transaction types before deciding.
Related Articles
- KuCoin vs Coinbase — Detailed Comparison 2026
- Worldcoin vs Stellar — Detailed Comparison 2026
- Binance vs Bybit — Detailed Comparison 2026