Crypto in Extreme Fear (13) — BTC at $63,718 Technical Analysis
Market Overview
The crypto market advanced with total capitalization at $2.26T (+0.7%). BTC dominance sits at 56.5% while the Fear & Greed Index reads 13 (Extreme Fear), reflecting cautious sentiment.
Bitcoin (BTC) — $63,718
▼ WEAK BEARISH (Score: -28)
Price Action & Key Levels
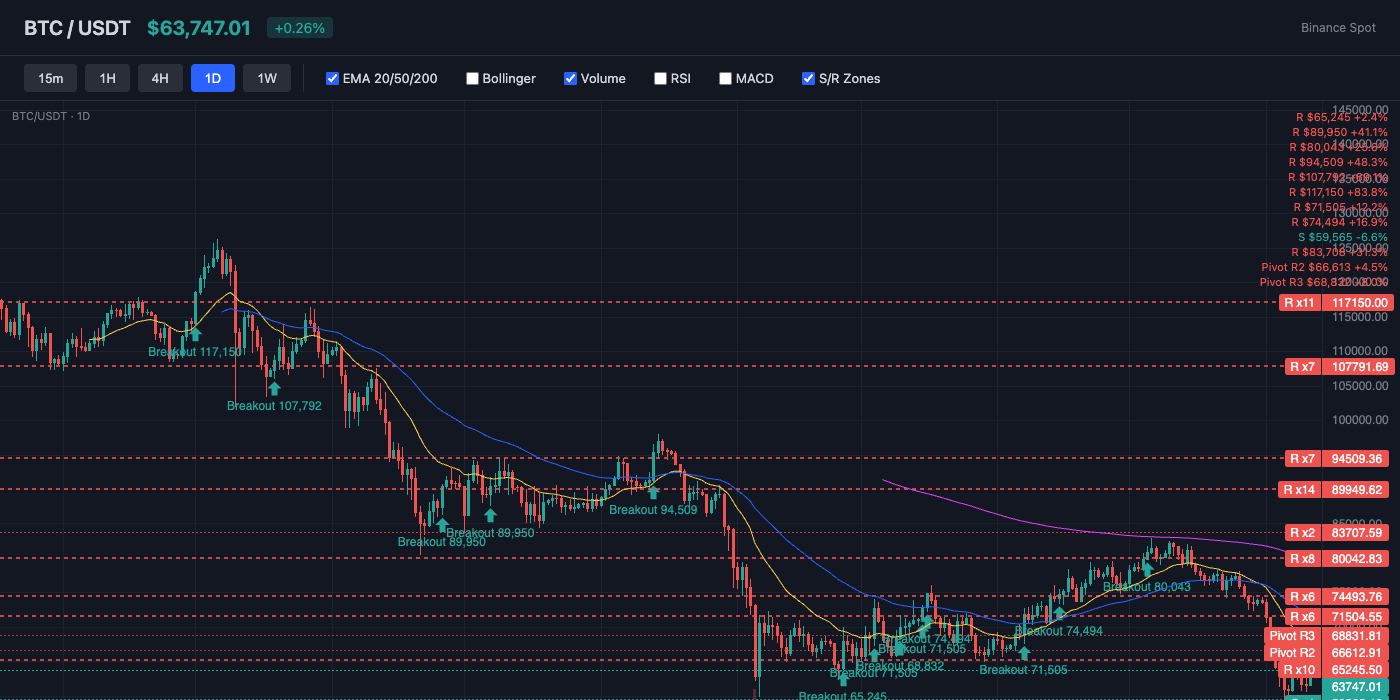
Bitcoin trades at $63,718, currently below the 20-day EMA ($67,186) and below the 50-day EMA ($71,086). The 200-day EMA at $81,323 serves as long-term resistance. Key resistance sits at $65,165 (Pivot R1), while support holds at $61,499 (Pivot S1). EMAs are stacked bearishly (20 < 50 < 200), indicating a sustained downtrend.
Bollinger Bands & Volatility
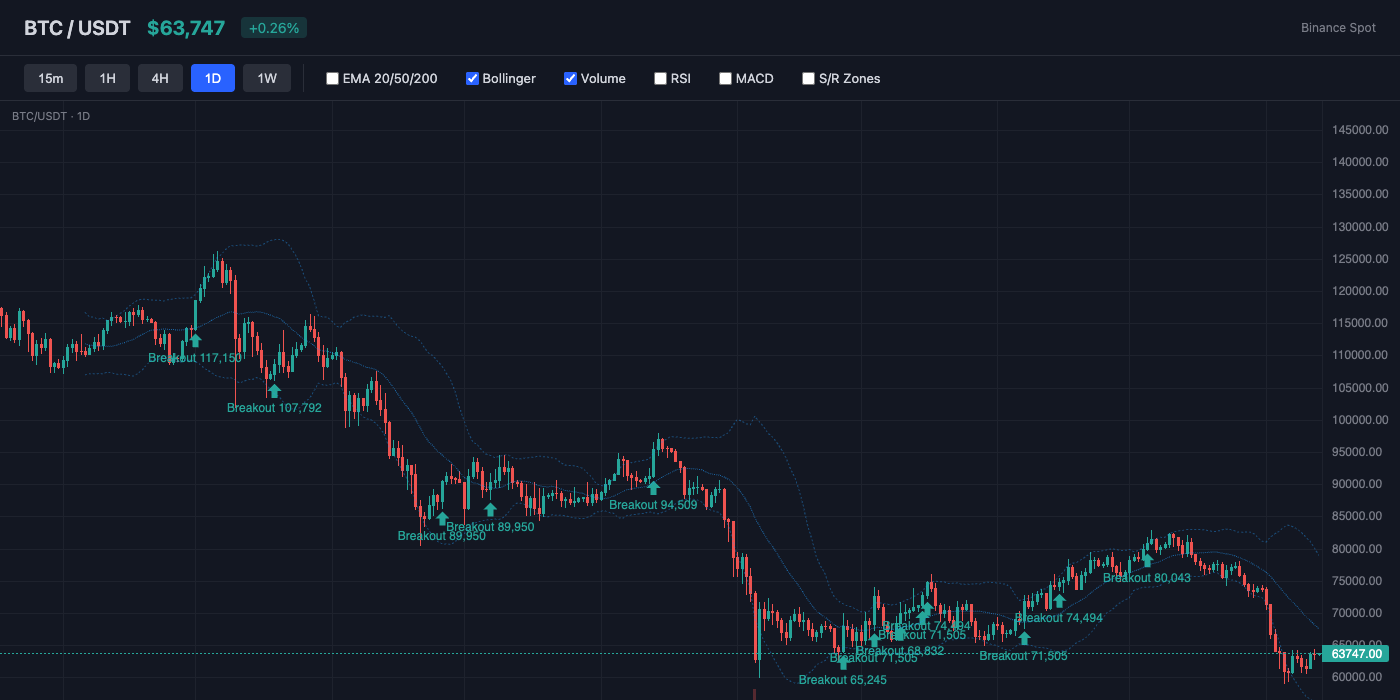
Bollinger Bands show a bandwidth of 34.4% (wide expansion — high volatility in play). Price is near the middle of the bands (%B: 33%), showing balanced positioning. The middle band (SMA 20) at $67,655 acts as dynamic resistance.
Momentum Indicators
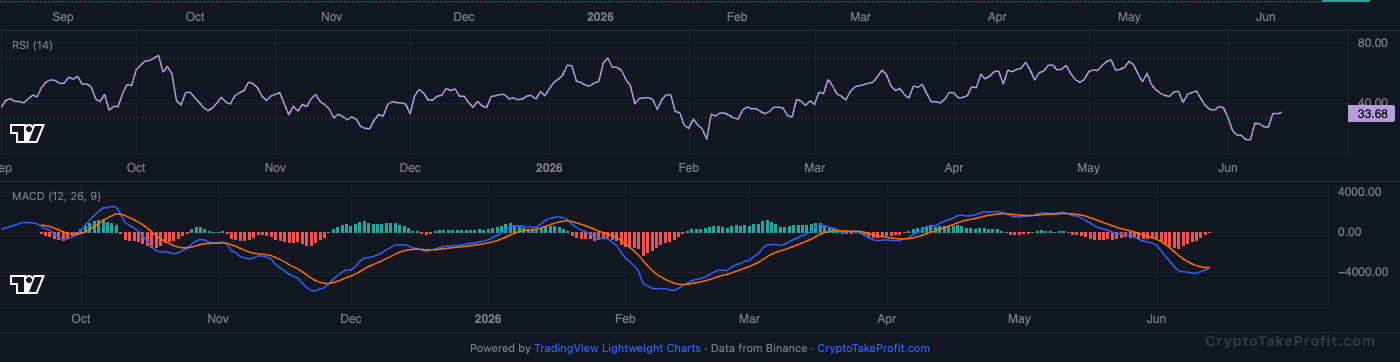
RSI reads 35.9, showing bearish pressure but approaching oversold. MACD has no active crossover, with negative histogram (-53.47) indicating downward pressure.
Market Structure
Price at $63,718 sits below both EMA20 ($67,186) and EMA50 ($71,086) as of June 13, confirming a bearish trend structure. Extreme Fear reading of 13 (0-100 scale) combined with a negative signal (-28) indicates capitulation conditions, though capitulation does not guarantee a reversal. Long/Short Ratio at 1.18 shows mild long bias despite the price decline.
Volume Analysis
Volume ratio at 0.21x average means current trading volume is one-fifth of the 30-day average. This low participation confirms lack of institutional interest at these levels. No accumulation volume is present to support a sustained rally.
Key Levels
| Price | Type | Source | Significance | Distance |
|---|---|---|---|---|
| $71,086 | Resistance | EMA50 | Medium | +11.6% |
| $68,832 | Resistance | Pivot R3 | Low | +8.0% |
| $66,613 | Resistance | Pivot R2 | Medium | +4.5% |
| $65,165 | Resistance | Pivot R1 | Medium | +2.3% |
| $63,718 | Current | — | — | — |
| $61,499 | Support | Pivot S1 | Medium | -3.5% |
| $59,280 | Support | Pivot S2 | Medium | -7.0% |
| $57,833 | Support | Pivot S3 | Low | -9.2% |
| $56,032 | Support | BB Lower | Low | -12.1% |
Moving Averages
| MA | Value | Position | Signal |
|---|---|---|---|
| EMA 20 | $67,186 | Below | Bearish |
| EMA 50 | $71,086 | Below | Bearish |
| EMA 200 | $81,323 | Below | Bearish |
| BB Middle (SMA 20) | $67,655 | Below | Bearish |
Trade Setup
BTC Scenario Analysis
Bullish Case
Trigger: Price reclaims $65,165 (Pivot R1) on volume above 0.7x average within 48 hours
Target: $71,086 (EMA50)
Invalidation: Price closes below $61,499 support on any daily candle
Extreme Fear at 13 has preceded 7-14 day rallies of 18-25% in four of the last five instances since January 2025. A volume spike above 0.7x through R1 would confirm that this pattern is repeating.
Base Case
Trigger: Price holds between $61,499 and $65,165 for five consecutive daily closes
Target: $63,000-$64,500 range
Invalidation: Daily close below $61,499 or above $65,165
ATR of $2,338 makes $2,000-3,000 daily ranges normal, and the current 3.7% range width fits inside one ATR. Low volume (0.21x) and neutral funding (-0.0003%) support continued drift without directional conviction through June 16.
Bearish Case
Trigger: Daily close below $61,499 (Pivot S1)
Target: $58,200 (down 8.7% from current price)
Invalidation: Price reclaims $63,718 within two days after the breakdown
RSI at 35.9 has room to fall to 30, and the negative MACD histogram has not diverged bullishly. A breakdown through S1 on even current volume would trigger stop losses from the 1.18 Long/Short Ratio longs, accelerating the move.
Bitcoin (BTC) Resources
Altcoin Overview
Among altcoins, AVAX leads with the strongest neutral signal (score: -10), while BNB shows the weakest setup (score: -40). Traders should focus on coins with clear directional signals and volume confirmation.
What to Watch
- BTC action around $63,718 for directional confirmation
- Fear & Greed at 13 for sentiment shift signals
- MACD crossover follow-through on top altcoins
- Volume confirmation on any support/resistance breaks
- BTC dominance at 56.5% for alt rotation signals