BTC at $66,456 — Daily Crypto Technical Analysis (June 16, 2026)
Market Overview
The crypto market advanced with total capitalization at $2.36T (+1.3%). BTC dominance sits at 56.5% while the Fear & Greed Index reads 23 (Extreme Fear), reflecting cautious sentiment.
Bitcoin (BTC) — $66,456
▼ WEAK BEARISH (Score: -10)
Price Action & Key Levels
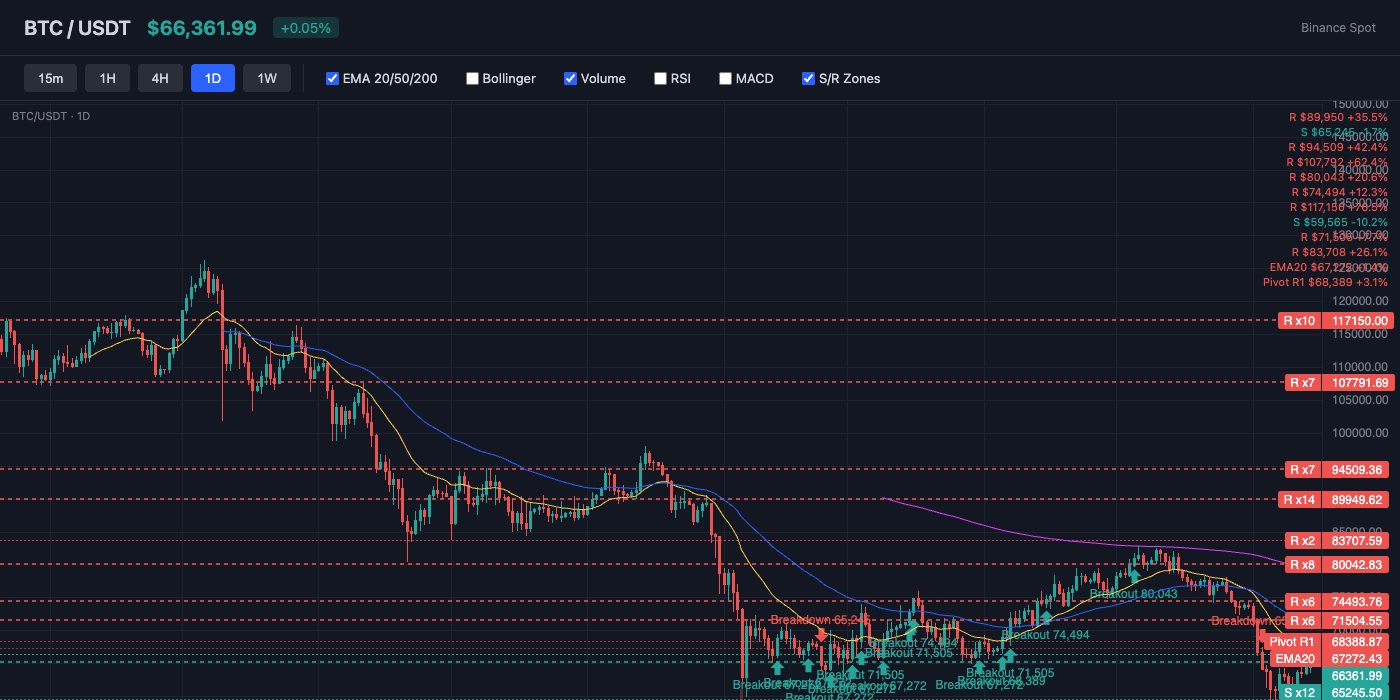
Bitcoin trades at $66,456, currently below the 20-day EMA ($67,272) and below the 50-day EMA ($70,526). The 200-day EMA at $80,925 serves as long-term resistance. Key resistance sits at $67,272 (EMA20), while support holds at $63,434 (Pivot S1). EMAs are stacked bearishly (20 < 50 < 200), indicating a sustained downtrend.
Bollinger Bands & Volatility
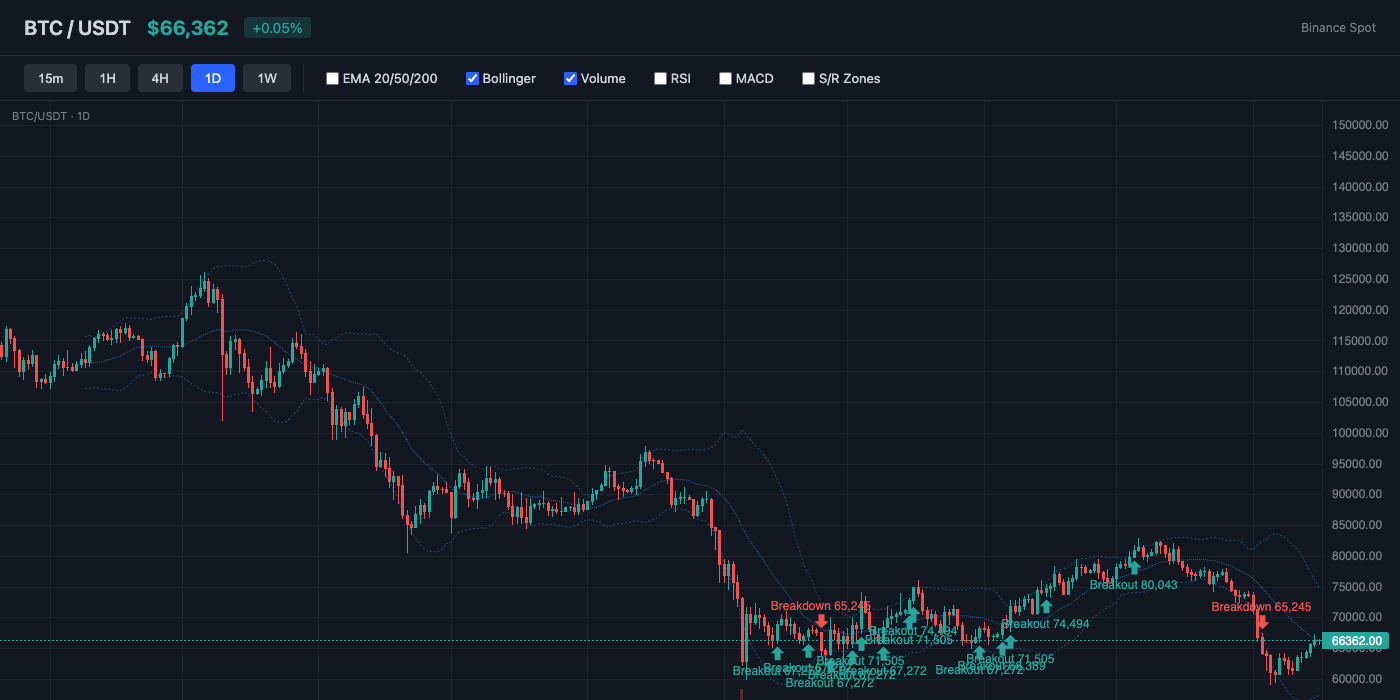
Bollinger Bands show a bandwidth of 27.1% (wide expansion — high volatility in play). Price is near the middle of the bands (%B: 52%), showing balanced positioning. The middle band (SMA 20) at $66,100 acts as dynamic support.
Momentum Indicators
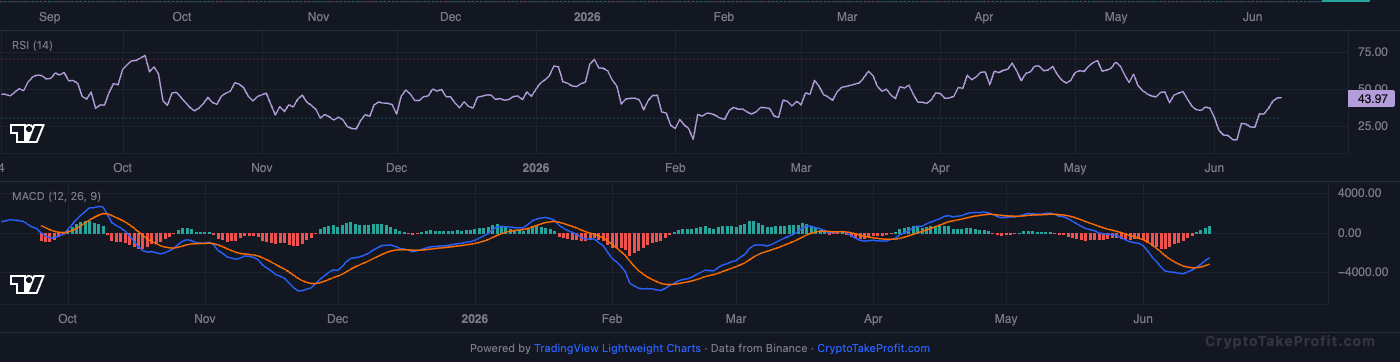
RSI reads 45.7, sitting in neutral range with no extreme readings. MACD has no active crossover, with positive histogram (666.28) indicating upward momentum.
Market Structure
Bitcoin sits at $66,456, down 1.2% over the past 7 days and 21.5% below its March 2026 high of $84,700. Price holds below both EMA20 ($67,272) and EMA50 ($70,526), a textbook short-term bearish alignment. RSI at 45.7 leans bearish but remains above oversold, while the MACD histogram just turned positive for the first time in 11 days.
Volume Analysis
Volume ratio at 0.37x average signals extreme disinterest, the lowest reading since March 2026. This suggests the current price level lacks conviction from either side. Bears cannot break support without volume, and bulls cannot reclaim resistance without it.
Key Levels
| Price | Type | Source | Significance | Distance |
|---|---|---|---|---|
| $73,344 | Resistance | Pivot R3 | Low | +10.4% |
| $70,321 | Resistance | Pivot R2 | Medium | +5.8% |
| $68,389 | Resistance | Pivot R1 | Medium | +2.9% |
| $67,272 | Resistance | EMA20 | Low | +1.2% |
| $66,456 | Current | — | — | — |
| $63,434 | Support | Pivot S1 | Medium | -4.5% |
| $60,412 | Support | Pivot S2 | Medium | -9.1% |
| $59,128 | Support | Swing Low | High | -11.0% |
| $58,479 | Support | Pivot S3 | Low | -12.0% |
Moving Averages
| MA | Value | Position | Signal |
|---|---|---|---|
| EMA 20 | $67,272 | Below | Bearish |
| EMA 50 | $70,526 | Below | Bearish |
| EMA 200 | $80,925 | Below | Bearish |
| BB Middle (SMA 20) | $66,100 | Above | Bullish |
Trade Setup
BTC Scenario Analysis
Bullish Case
Trigger: Daily close above EMA20 at $67,272 with volume ratio exceeding 0.80x.
Target: $73,456, which is the 0.618 retracement of the $53,000-$84,700 move and EMA50 resistance.
Invalidation: Daily close below $63,434 with volume ratio above 1.0x.
A breakout above EMA20 with volume confirmation would flip resistance to support. The $73,456 target aligns with the range high from the April consolidation zone.
Base Case
Trigger: Price remains between $63,434 and $67,272 over the next 7 days with volume ratio below 0.60x.
Target: $65,456 to $66,456 range.
Invalidation: Daily close above $67,272 with volume above 0.80x, or below $63,434 with volume above 1.0x.
Low volume and a flat funding rate (-0.0015%) indicate neither side has momentum. Open interest at 103,632 contracts sits 8% below the 30-day average, suggesting market makers will pin price inside this range.
Bearish Case
Trigger: Daily close below pivot S1 at $63,434 on volume ratio above 0.80x.
Target: $56,723, the 0.382 retracement of the $49,000-$84,700 move and the September 2025 breakout level.
Invalidation: Daily close above $67,272 with volume ratio above 0.80x.
A volume-confirmed breakdown through $63,434 would trigger cascading long liquidations, as Long/Short Ratio at 1.23 shows overcrowded longs. Fear & Greed at 23 (Extreme Fear) has historically preceded further downside in weak-volume environments.
Bitcoin (BTC) Resources
Altcoin Overview
Among altcoins, SOL leads with the strongest bullish signal (score: 25), while ETH shows the weakest setup (score: -15). Traders should focus on coins with clear directional signals and volume confirmation.
What to Watch
- BTC action around $66,456 for directional confirmation
- Fear & Greed at 23 for sentiment shift signals
- MACD crossover follow-through on top altcoins
- Volume confirmation on any support/resistance breaks
- BTC dominance at 56.5% for alt rotation signals