Crypto in Extreme Fear (15) — BTC at $64,051 Technical Analysis
Market Overview
Largest stress signal is BNB at $588.40 with -50 score, underperforming BTC at $64,051 and ETH at $1,733. Fear & Greed at 15 (Extreme Fear) indicates sustained deleveraging, while BTC dominance at 56.1% confirms capital consolidation into BTC rather than alt rotation. Market remains defensive with no structural bullish break across majors.
Bitcoin (BTC) — $64,051
▼ WEAK BEARISH (Score: -15)
Price Action & Key Levels
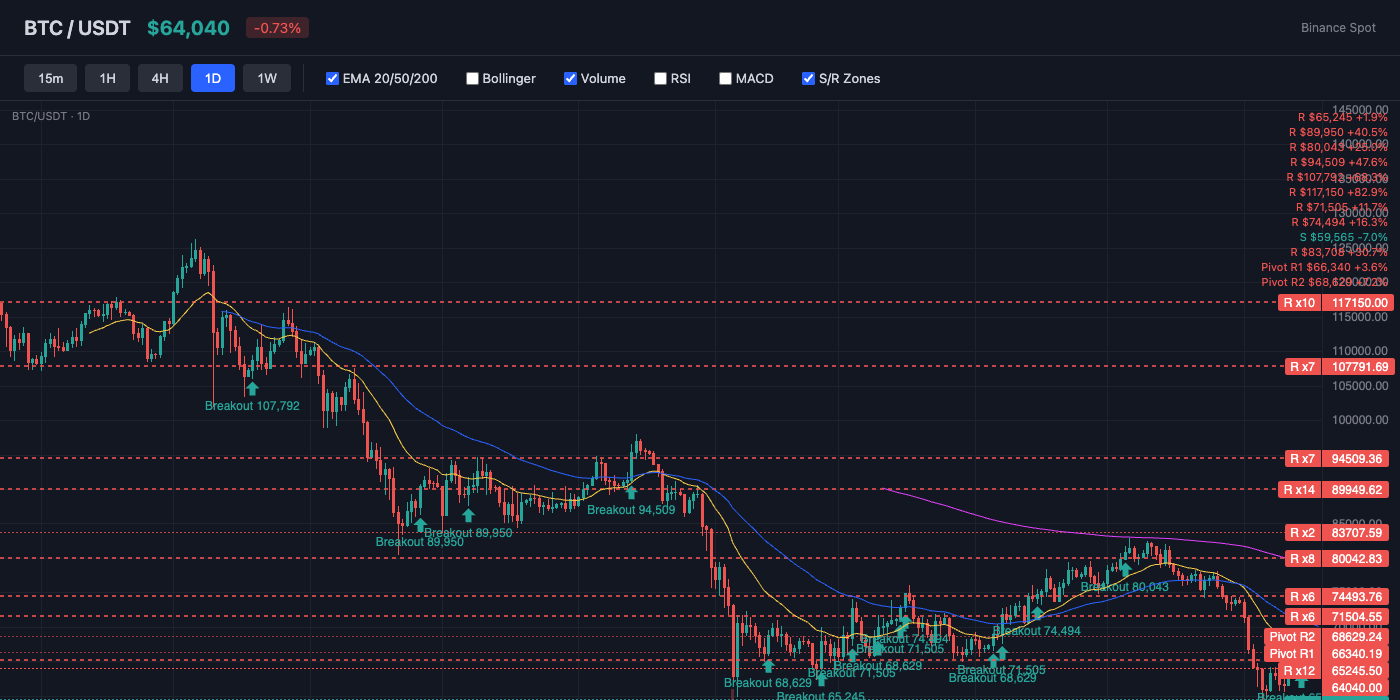
Bitcoin trades at $64,051, currently below the 20-day EMA ($66,925) and below the 50-day EMA ($70,071). The 200-day EMA at $80,624 serves as long-term resistance. Key resistance sits at $66,340 (Pivot R1), while support holds at $62,721 (Pivot S1). EMAs are stacked bearishly (20 < 50 < 200), indicating a sustained downtrend.
Bollinger Bands & Volatility
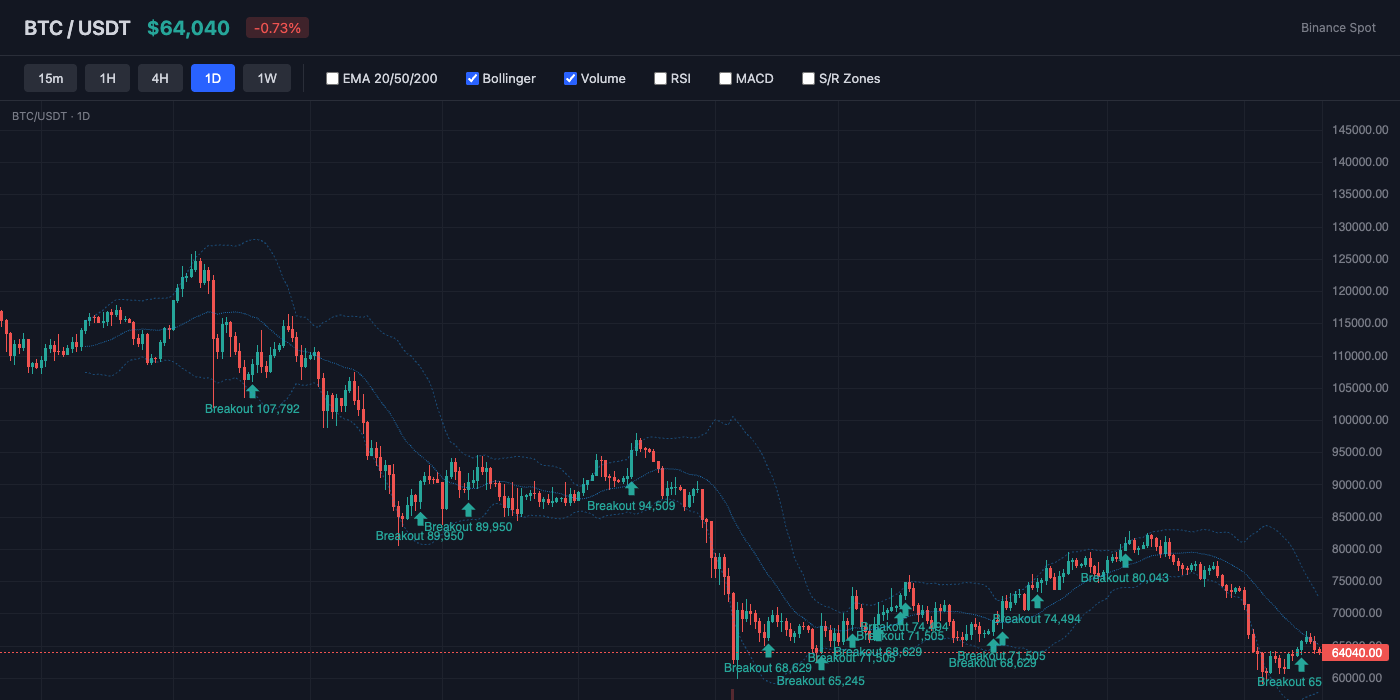
Bollinger Bands show a bandwidth of 23.1% (wide expansion — high volatility in play). Price is near the middle of the bands (%B: 42%), showing balanced positioning. The middle band (SMA 20) at $65,224 acts as dynamic resistance.
Momentum Indicators
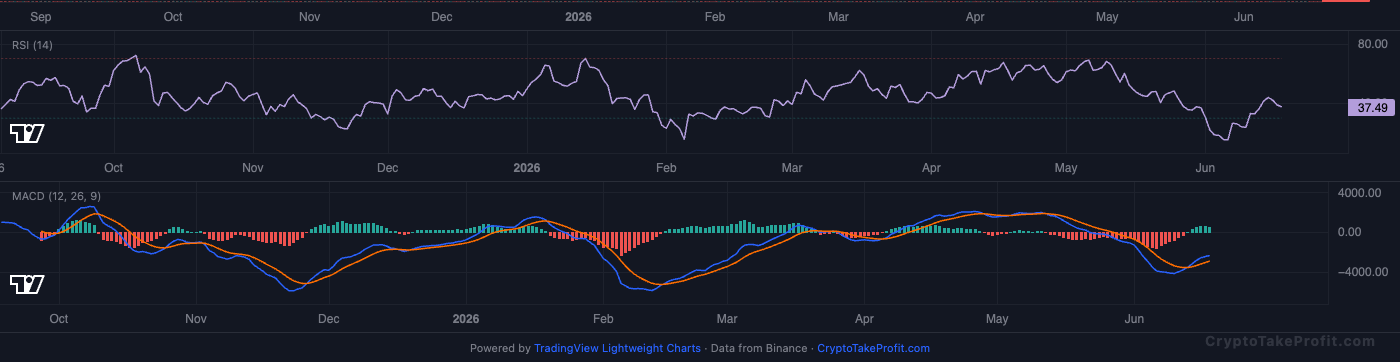
RSI reads 40.0, sitting in neutral range with no extreme readings. MACD has no active crossover, with positive histogram (624.49) indicating upward momentum.
Market Structure
BTC trades at $64,051, below EMA50 at $70,071, while BB %B sits at 42.2%, which places price in the lower half of the Bollinger range. Fear & Greed at 15 (Extreme Fear) vs market cap $2.29T (-2.0%) shows risk-off conditions while structure stays range-bound between $62,721 support and $66,340 resistance. ATR at $2,340 signals daily moves near 3.6% volatility at current price levels.
Volume Analysis
Volume ratio is 0.62x average, which shows participation below normal and confirms lack of strong trend conviction. Open interest at 100,106 contracts vs funding rate 0.0025% shows mild long bias without aggressive leverage expansion. This combination reflects positioning without strong directional confirmation.
Key Levels
| Price | Type | Source | Significance | Distance |
|---|---|---|---|---|
| $72,758 | Resistance | BB Upper | Low | +13.6% |
| $69,959 | Resistance | Pivot R3 | Low | +9.2% |
| $68,629 | Resistance | Pivot R2 | Medium | +7.1% |
| $66,340 | Resistance | Pivot R1 | Medium | +3.6% |
| $64,051 | Current | — | — | — |
| $62,721 | Support | Pivot S1 | Medium | -2.1% |
| $61,391 | Support | Pivot S2 | Medium | -4.2% |
| $59,102 | Support | Pivot S3 | Low | -7.7% |
| $57,690 | Support | BB Lower | Low | -9.9% |
Moving Averages
| MA | Value | Position | Signal |
|---|---|---|---|
| EMA 20 | $66,925 | Below | Bearish |
| EMA 50 | $70,071 | Below | Bearish |
| EMA 200 | $80,624 | Below | Bearish |
| BB Middle (SMA 20) | $65,224 | Below | Bearish |
Trade Setup
BTC Scenario Analysis
Bullish Case
Trigger: N/A
Target: N/A
Invalidation: N/A
Base Case
Trigger: N/A
Target: N/A
Invalidation: N/A
Bearish Case
Trigger: BTC loses $62,721 support with open interest falling below 95,000 contracts
Target: $60,000
Invalidation: N/A
Bitcoin (BTC) Resources
Altcoin Overview
Among altcoins, ADA leads with the strongest bullish signal (score: 2), while BNB shows the weakest setup (score: -50). Traders should focus on coins with clear directional signals and volume confirmation.
What to Watch
- BTC $64,051 support holds at RSI 40.0, break below risks momentum shift
- ETH $1,733 resistance near RSI 42.2, rejection keeps bearish pressure
- BNB $588.40 weak zone with -50 score, watch $580 breakdown risk
- ADA $0.1652 divergence with RSI 35.0, watch recovery above 0.17
- SOL $71.23 range bound near RSI 45.5, watch breakout above 75 resistance