Ethereum (ETH) Interactive Chart Analysis — August 24, 2026
ETH at $2,457 — interactive chart with EMA, BB, RSI, MACD, S/R levels. CONFLICTED neutral signal (10). Funding rate 0.0100%.
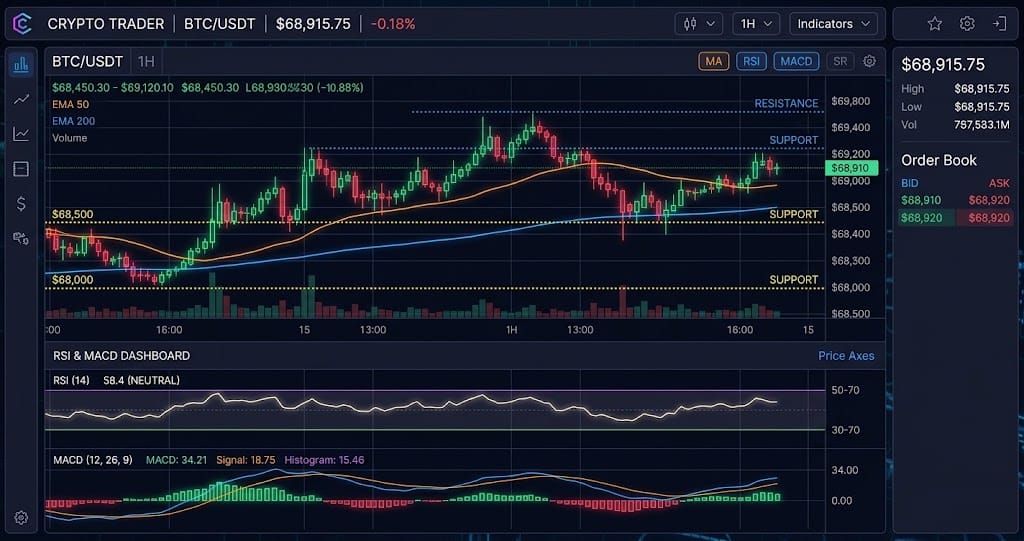
Interactive chart — switch timeframes, toggle indicators, hover for OHLC data
Market Structure
ETH trades at $2,457, just 0.7% below the upper Bollinger Band resistance at $2,474. RSI at 87.8 marks the most overbought condition since at least March 2024, per the provided data. Price sits 16.4% above the EMA20 ($2,110) and 24.4% above the EMA50 ($1,975), confirming a steep vertical rally.
Key Levels
| Price | Type | Source | Significance | Distance |
|---|---|---|---|---|
| $3,126 | Resistance | Pivot R3 | Low | +27.2% |
| $2,837 | Resistance | Pivot R2 | Medium | +15.4% |
| $2,647 | Resistance | Pivot R1 | Medium | +7.7% |
| $2,474 | Resistance | BB Upper | Low | +0.7% |
| $2,457 | Current | — | — | — |
| $2,168 | Support | Pivot S1 | Medium | -11.8% |
| $2,110 | Support | EMA20 | Low | -14.1% |
| $1,975 | Support | EMA50 | Medium | -19.6% |
| $1,878 | Support | Pivot S2 | Medium | -23.6% |
Moving Averages
| MA | Value | Position | Signal |
|---|---|---|---|
| EMA 20 | $2,110 | Above | Bullish |
| EMA 50 | $1,975 | Above | Bullish |
| EMA 200 | $2,154 | Above | Bullish |
| BB Middle (SMA 20) | $2,033 | Above | Bullish |
Volume Analysis
Volume sits at 1.58x the 30-day average, according to the volume ratio metric. This elevated participation supports the current price level but does not confirm breakout direction. The positive MACD histogram and 1.77 long/short ratio suggest buyers dominate, yet funding at 0.0100% remains below the 0.02% level that typically signals overheating.
Technical Indicators
Trade Setup
Scenario Analysis
Bullish Case
Trigger: daily close above $2,474 (BB Upper) with volume remaining above 1.5x average.
Target: $2,600 (the next psychological resistance and 1.618 Fibonacci extension from the $2,168 support).
Invalidation: price drops back below $2,350 within 48 hours.
A clean break above $2,474 would trigger stop-losses from short sellers, given open interest of 2.4 million contracts. However, RSI at 87.8 leaves only 5-7% upside before extreme exhaustion historically caps further gains.
Base Case
Trigger: rejection at $2,474 holding, but price stays above the pivot support at $2,168 over the next 3-5 sessions.
Target: range between $2,300 and $2,450, with ATR of $83.93 implying daily swings of roughly $80.
Invalidation: a daily close below $2,168 or above $2,474.
Sideways consolidation allows RSI to cool from 87.8 toward 70 without a sharp selloff. The 1.58x volume ratio and positive funding rate of 0.0100% indicate active two-way trading, which supports a range-bound resolution.
Bearish Case
Trigger: failure to break $2,474 followed by a daily close under $2,300.
Target: $2,168 (Pivot S1 support), a 11.8% drop from current price.
Invalidation: ETH breaks above $2,474 on high volume.
Overbought RSI at 87.8 and a long/short ratio of 1.77 (heavily skewed long) create a classic flush setup. If sellers push below $2,300, the 1.58x average volume could accelerate downside toward $2,168, as no pattern support exists to catch the fall.
Analysis Summary
Ethereum (ETH) Resources