Solana (SOL) Interactive Chart Analysis — August 24, 2026
SOL at $94.13 — interactive chart with EMA, BB, RSI, MACD, S/R levels. CONFLICTED neutral signal (10). Funding rate 0.0100%.
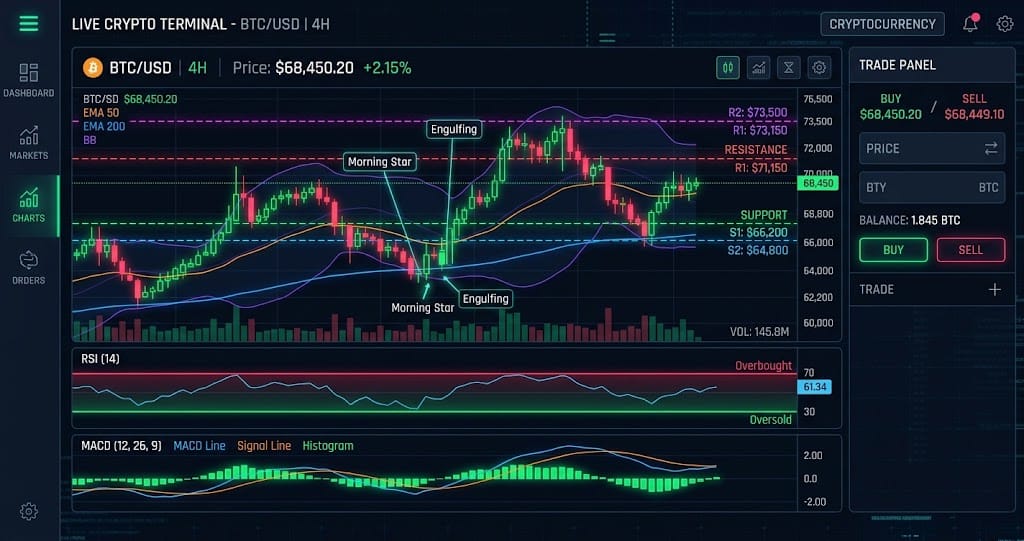
Interactive chart — switch timeframes, toggle indicators, hover for OHLC data
Market Structure
Price at $94.13 sits 14.2% above EMA20 ($82.39) and 19.3% above EMA50 ($78.90), per the provided indicators. RSI at 81.2 signals extreme overbought, while BB %B at 97.7% places price directly at the upper band resistance of $94.80. The MACD histogram remains positive but lacks a confirmed crossover, suggesting momentum is waning.
Key Levels
| Price | Type | Source | Significance | Distance |
|---|---|---|---|---|
| $125.94 | Resistance | Pivot R3 | Low | +33.8% |
| $114.34 | Resistance | Pivot R2 | Medium | +21.5% |
| $104.23 | Resistance | Pivot R1 | Medium | +10.7% |
| $94.80 | Resistance | BB Upper | Low | +0.7% |
| $94.13 | Current | — | — | — |
| $89.43 | Support | EMA200 | High | -5.0% |
| $82.52 | Support | Pivot S1 | Medium | -12.3% |
| $78.90 | Support | EMA50 | Medium | -16.2% |
| $70.92 | Support | Pivot S2 | Medium | -24.7% |
Moving Averages
| MA | Value | Position | Signal |
|---|---|---|---|
| EMA 20 | $82.39 | Above | Bullish |
| EMA 50 | $78.90 | Above | Bullish |
| EMA 200 | $89.43 | Above | Bullish |
| BB Middle (SMA 20) | $80.02 | Above | Bullish |
Volume Analysis
Volume ratio of 1.18x average indicates buying pressure slightly exceeds the 30-day norm, but not at panic-buy levels. Open interest at 7.93 million contracts and a long/short ratio of 2.47 show a heavily skewed long positioning. This setup makes the market vulnerable to a long squeeze if support fails, as the funding rate of 0.0100% is too low to deter new shorts.
Technical Indicators
Trade Setup
Scenario Analysis
Bullish Case
Trigger: daily close above $94.80 with volume ratio sustaining above 1.5x.
Target: $102.50 (measured move from the EMA20 breakout plus the ATR of $3.85).
Invalidation: daily close below $89.43.
A confirmed break above the upper Bollinger band would override the overbought RSI, as strong uptrends can remain stretched. The low funding rate leaves room for short covering, and a push to $102.50 would represent a 9% gain from current levels.
Base Case
Trigger: price rejects $94.80 but holds above $89.43, with RSI cooling toward 70 over 3-5 sessions.
Target: $89.50 to $94.50 range.
Invalidation: break above $94.80 on volume or break below $89.43.
The overextended RSI and upper band resistance favor a sideways consolidation to absorb recent gains. Volume at 1.18x and the conflicted signal (10) support a grind within a $5 band, with the EMA200 at $89.43 acting as the floor.
Bearish Case
Trigger: daily close below $89.43 (EMA200 support).
Target: $82.39 (EMA20).
Invalidation: price recovers above $94.80.
A break below the EMA200 would trigger forced liquidations given the 2.47 long/short ratio, accelerating downside toward the EMA20. The ATR of $3.85 makes a $7.74 move to $82.39 achievable within 1-2 sessions, with the overbought RSI providing strong bearish confluence.
Analysis Summary
Solana (SOL) Resources