Solana (SOL) Interactive Chart Analysis — September 2, 2026
SOL at $99.25 — interactive chart with EMA, BB, RSI, MACD, S/R levels. WEAK bullish signal (33). Funding rate -0.0019%.
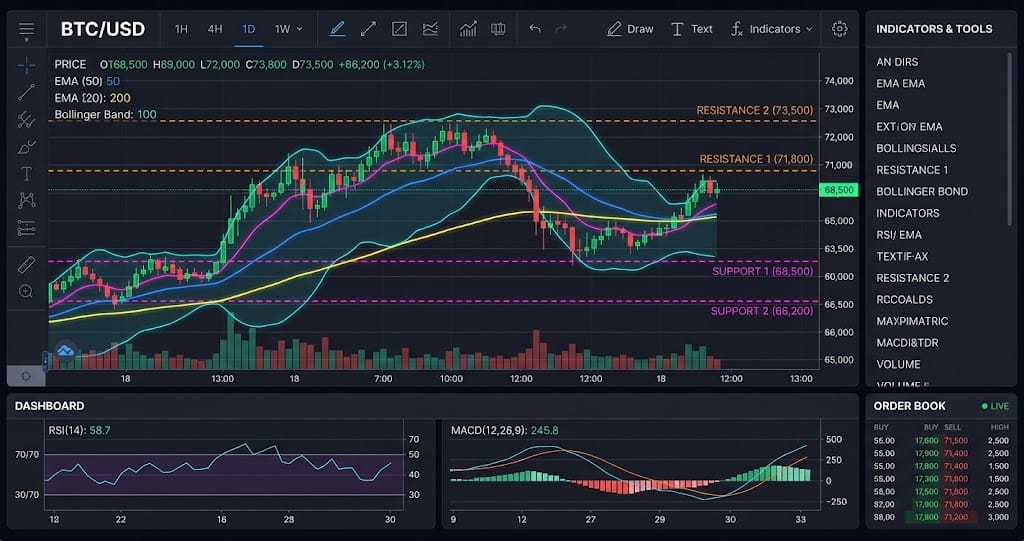
Interactive chart — switch timeframes, toggle indicators, hover for OHLC data
Market Structure
SOL trades at $99.25 with a Signal of 33, indicating a WEAK bullish trend. RSI at 63.6, price above the EMA20 at $93.66 and EMA50 at $86.11, and a positive MACD histogram support upward momentum, while $105.03 remains the nearest resistance. The structure stays bullish above $95.91 support, but BB %B at 65.2% shows price has already moved into the upper half of its recent range. As of September 2, 2026, SOL needs a clean break above $105.03 to strengthen the bullish signal.
Key Levels
| Price | Type | Source | Significance | Distance |
|---|---|---|---|---|
| $114.15 | Resistance | Pivot R3 | Low | +15.0% |
| $110.81 | Resistance | Pivot R2 | Medium | +11.6% |
| $105.03 | Resistance | Pivot R1 | Medium | +5.8% |
| $99.25 | Current | — | — | — |
| $95.91 | Support | Pivot S1 | Medium | -3.4% |
| $93.66 | Support | EMA20 | Low | -5.6% |
| $92.57 | Support | Pivot S2 | Medium | -6.7% |
| $89.88 | Support | EMA200 | High | -9.4% |
Moving Averages
| MA | Value | Position | Signal |
|---|---|---|---|
| EMA 20 | $93.66 | Above | Bullish |
| EMA 50 | $86.11 | Above | Bullish |
| EMA 200 | $89.88 | Above | Bullish |
| BB Middle (SMA 20) | $92.38 | Above | Bullish |
Volume Analysis
Volume is only 0.81x average at a price of $99.25, so the current advance lacks strong participation. The positive MACD histogram and RSI of 63.6 support momentum, but below-average volume does not strongly confirm an immediate breakout. Funding is slightly negative at -0.0019% despite a 2.09 long/short ratio and open interest of 8,478,757 contracts. A move above $105.03 with volume above 1.00x average would provide a clearer bullish confirmation.
Technical Indicators
Trade Setup
Scenario Analysis
Bullish Case
Trigger: SOL closes above $105.03 with volume above 1.00x average.
Target: $114.41
Invalidation: $95.91
A breakout above $105.03 would confirm that price remains above both the $93.66 EMA20 and $86.11 EMA50, extending the current WEAK bullish structure. With RSI at 63.6 and a positive MACD histogram, momentum supports an advance toward $114.41, approximately two ATR moves above the current price.
Base Case
Trigger: SOL remains between $95.91 and $105.03 without volume exceeding 1.00x average.
Target: $95.91-$105.03
Invalidation: A sustained close above $105.03 or below $95.91.
The most likely consolidation case keeps SOL inside its current pivot range because volume remains weak at 0.81x average. RSI at 63.6 supports buyers, but the lack of volume confirmation makes sideways trading between $95.91 and $105.03 plausible.
Bearish Case
Trigger: SOL closes below $95.91 with selling volume above 1.00x average.
Target: $86.11
Invalidation: $105.03
A break below $95.91 would damage the current bullish structure and expose the EMA20 at $93.66 before the EMA50 at $86.11. The bearish case gains strength if the 0.81x volume ratio rises during the decline, confirming that sellers have replaced the current weak participation.
Analysis Summary
Solana (SOL) Resources