Solana (SOL) Interactive Chart Analysis — September 1, 2026
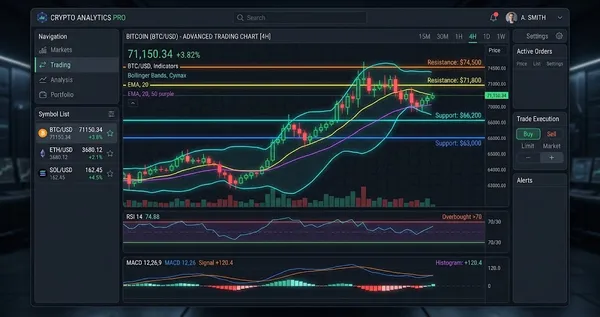
SOL at $101.95 — interactive chart with EMA, BB, RSI, MACD, S/R levels. WEAK bullish signal (33). Funding rate -0.0054%.
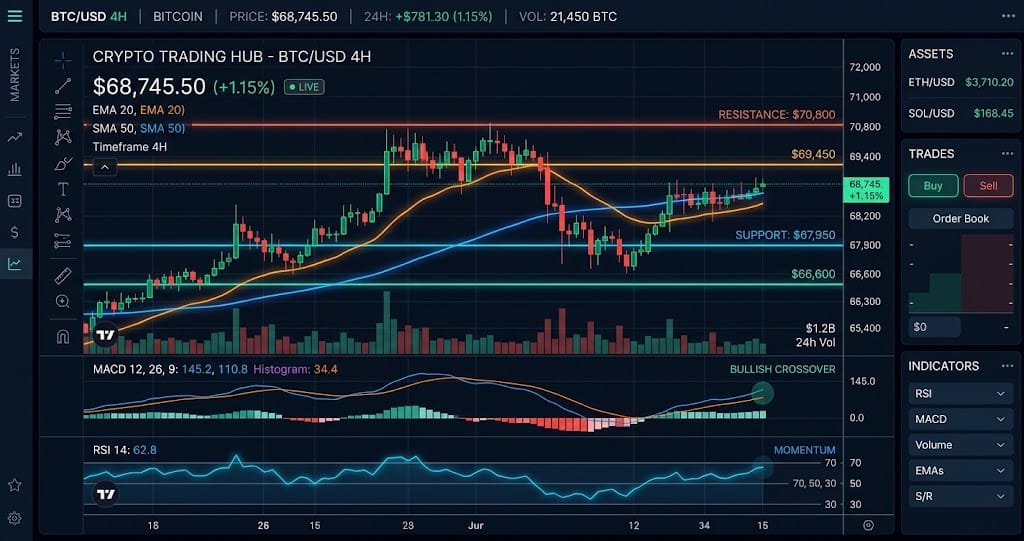
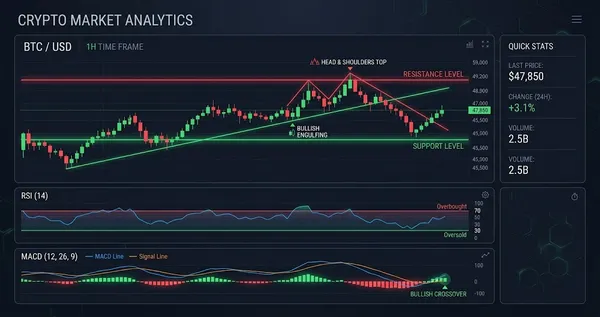
Interactive chart — switch timeframes, toggle indicators, hover for OHLC data
Market Structure
SOL trades at $101.95, sitting 9.3% above the EMA20 of $93.29 and 19.1% above the EMA50 of $85.56. The RSI at 69.9 approaches overbought but remains below the 70 threshold, while the positive MACD histogram signals ongoing bullish momentum. No identifiable chart patterns exist, making the current structure purely momentum-driven off the pivot support at $98.00.
Key Levels
| Price | Type | Source | Significance | Distance |
|---|---|---|---|---|
| $118.52 | Resistance | Pivot R3 | Low | +16.2% |
| $114.56 | Resistance | Pivot R2 | Medium | +12.4% |
| $108.26 | Resistance | Pivot R1 | Medium | +6.2% |
| $101.95 | Current | — | — | — |
| $98.00 | Support | Pivot S1 | Medium | -3.9% |
| $94.04 | Support | Pivot S2 | Medium | -7.8% |
| $89.84 | Support | EMA200 | High | -11.9% |
| $87.74 | Support | Pivot S3 | Low | -13.9% |
Moving Averages
| MA | Value | Position | Signal |
|---|---|---|---|
| EMA 20 | $93.29 | Above | Bullish |
| EMA 50 | $85.56 | Above | Bullish |
| EMA 200 | $89.84 | Above | Bullish |
| BB Middle (SMA 20) | $91.20 | Above | Bullish |
Volume Analysis
Volume sits at 0.74x the average, indicating weak participation behind the $101.95 price level. Per the supplied data, this low volume ratio contradicts the weak bullish signal reading of 33, suggesting the move lacks broad conviction. The negative funding rate of -0.0054% shows shorts are paying longs, yet the 0.74x volume fails to confirm any aggressive buying pressure.
Technical Indicators
Trade Setup
Scenario Analysis
Bullish Case
Trigger: A daily close above $108.26 (Pivot R1) with volume rising to at least 1.0x average.
Target: $117.50 (projecting a 2x ATR move of $9.40 above the breakout level).
Invalidation: A daily close below $98.00 (Pivot S1).
The EMA20 and EMA50 slope upward, and the positive MACD histogram provides structural support for a continuation. A break past $108.26 would force short covering, especially with open interest at 8,376,845 contracts and a long/short ratio of 1.99.
Base Case
Trigger: Price remains within the $98.00 to $108.26 range over the next 3 sessions while volume stays below 0.80x average.
Target: $100.50 to $104.50 range.
Invalidation: A breakout above $108.26 on volume exceeding 1.0x or a breakdown below $98.00 with increasing volume.
The 0.74x volume ratio and RSI at 69.9 indicate insufficient momentum for a directional breakout. With open interest holding at 8,376,845 contracts and a 1.99 long/short ratio, the market is over-leveraged long, which typically caps upside in low-volume conditions.
Bearish Case
Trigger: Price rejects $108.26 and breaks below $98.00 on volume above the average.
Target: $89.00 (the EMA50 at $85.56 plus a 0.75x ATR buffer).
Invalidation: A daily close above $108.26.
The long/short ratio at 1.99 is extremely skewed, leaving SOL exposed to a long squeeze if support at $98.00 fails. A break below that pivot would flip the level to resistance, with the next downside target at the EMA20 of $93.29, based on the provided pivot and moving average data.
Analysis Summary
Solana (SOL) Resources