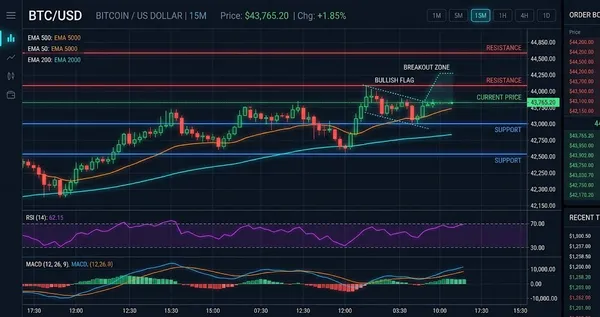
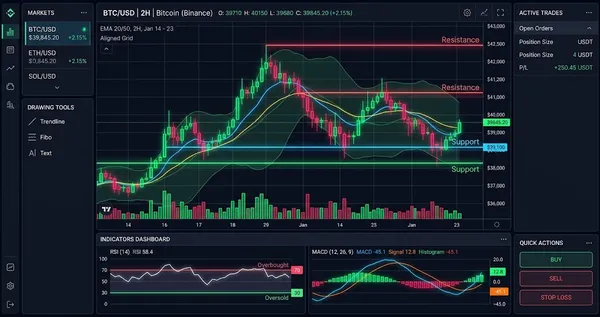
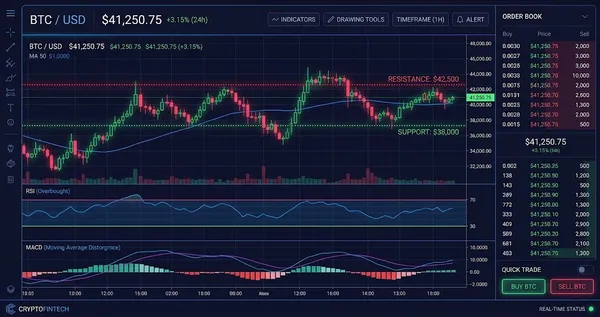
Bitcoin (BTC) Interactive Chart Analysis — July 13, 2026
BTC at $63,169 — interactive chart with EMA, BB, RSI, MACD, S/R levels. WEAK bullish signal (20). Funding rate 0.0029%.
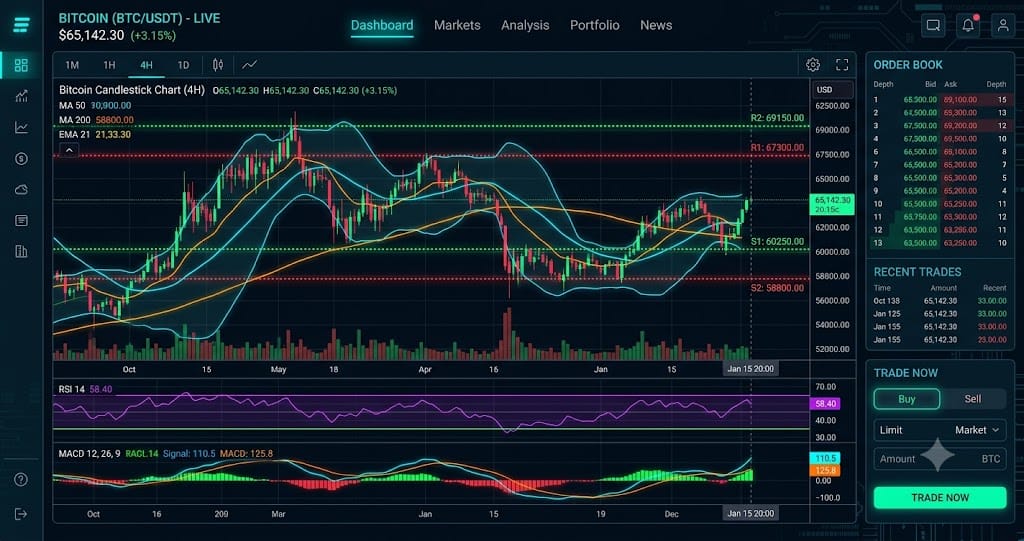
Interactive chart — switch timeframes, toggle indicators, hover for OHLC data
Market Structure
As of July 2026, BTC trades at $63,169 with a weak bullish signal of 20, while price is above the EMA20 at $63,021 but below the EMA50 at $65,167. RSI at 49.5 and BB %B at 69.5% show neutral momentum with room for upside, while the key structure remains dependent on a breakout above the $64,682 Pivot R1 resistance.
Key Levels
| Price | Type | Source | Significance | Distance |
|---|---|---|---|---|
| $76,675 | Resistance | EMA200 | High | +21.4% |
| $67,691 | Resistance | Pivot R3 | Low | +7.2% |
| $66,195 | Resistance | Pivot R2 | Medium | +4.8% |
| $64,682 | Resistance | Pivot R1 | Medium | +2.4% |
| $63,169 | Current | — | — | — |
| $63,021 | Support | EMA20 | Low | -0.2% |
| $61,673 | Support | Pivot S1 | Medium | -2.4% |
| $60,177 | Support | Pivot S2 | Medium | -4.7% |
| $58,664 | Support | Pivot S3 | Low | -7.1% |
Moving Averages
| MA | Value | Position | Signal |
|---|---|---|---|
| EMA 20 | $63,021 | Above | Bullish |
| EMA 50 | $65,167 | Below | Bearish |
| EMA 200 | $76,675 | Below | Bearish |
| BB Middle (SMA 20) | $61,802 | Above | Bullish |
Volume Analysis
Over the past 7 days, BTC volume remains weak with a volume ratio of 0.43x the average, showing limited participation behind the current move. The low volume confirms that the $63,169 price area lacks strong buying pressure, so a move above $64,682 requires a volume increase above the current 0.43x level.
Technical Indicators
Trade Setup
Scenario Analysis
Bullish Case
Trigger: N/A
Target: N/A
Invalidation: N/A
Base Case
Trigger: N/A
Target: N/A
Invalidation: N/A
Bearish Case
Trigger: BTC breaks below $63,021 EMA20 support and closes below that level.
Target: $60,500.
Invalidation: $64,682 Pivot R1 breakout.
BTC could enter a short-term decline if the EMA20 at $63,021 fails as support and sellers regain control. ATR at $1,955 suggests a move toward $60,500 would remain within the current volatility range.
Analysis Summary
Bitcoin (BTC) Resources