Solana (SOL) Interactive Chart Analysis — August 25, 2026
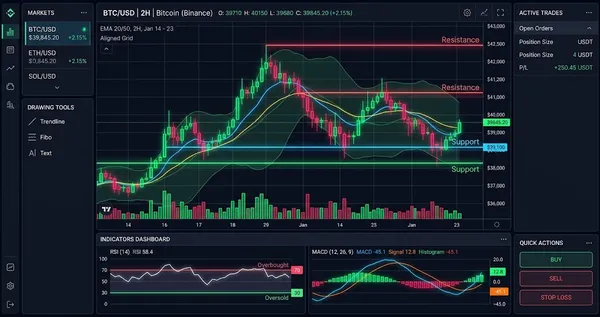
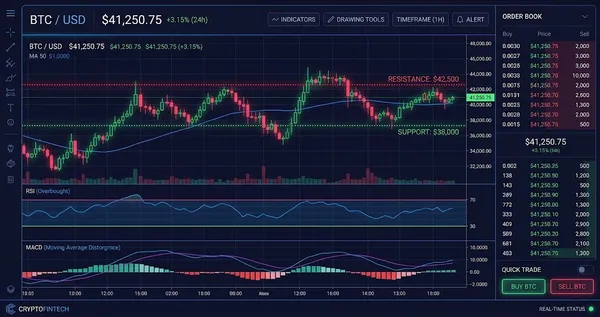
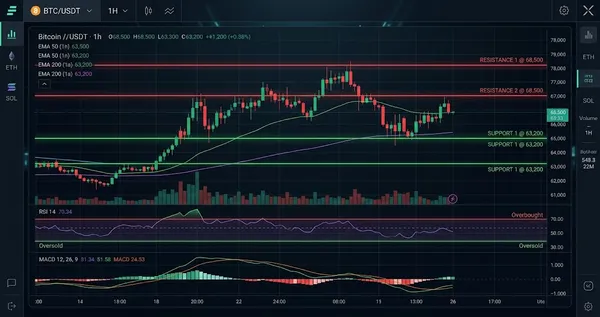
SOL at $100.44 — interactive chart with EMA, BB, RSI, MACD, S/R levels. CONFLICTED neutral signal (10). Funding rate 0.0100%.
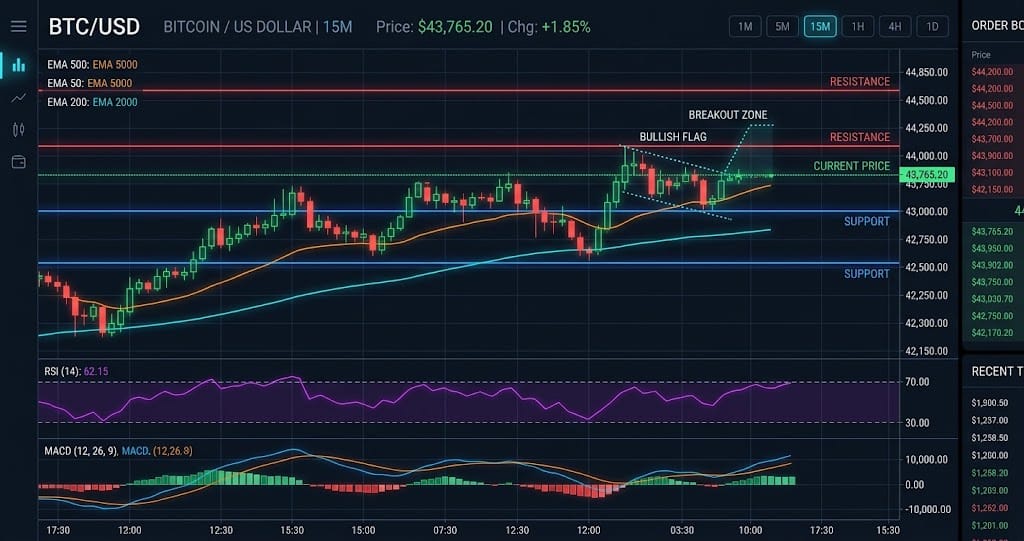
Interactive chart — switch timeframes, toggle indicators, hover for OHLC data
Market Structure
SOL is trading at $100.44, with price above the EMA20 at $84.28 and EMA50 at $79.83, while RSI at 88.7 shows an extremely overbought trend. The supplied SOL technical dataset shows BB %B at 104.8% and resistance at $106.76, so the structure remains bullish but vulnerable to a sharp pullback.
Key Levels
| Price | Type | Source | Significance | Distance |
|---|---|---|---|---|
| $123.13 | Resistance | Pivot R3 | Low | +22.6% |
| $113.09 | Resistance | Pivot R2 | Medium | +12.6% |
| $106.76 | Resistance | Pivot R1 | Medium | +6.3% |
| $100.44 | Current | — | — | — |
| $98.79 | Support | BB Upper | Low | -1.6% |
| $90.39 | Support | Pivot S1 | Medium | -10.0% |
| $89.45 | Support | EMA200 | High | -10.9% |
| $84.28 | Support | EMA20 | Low | -16.1% |
Moving Averages
| MA | Value | Position | Signal |
|---|---|---|---|
| EMA 20 | $84.28 | Above | Bullish |
| EMA 50 | $79.83 | Above | Bullish |
| EMA 200 | $89.45 | Above | Bullish |
| BB Middle (SMA 20) | $81.46 | Above | Bullish |
Volume Analysis
Volume is running at 2.24x the average, according to the supplied SOL technical dataset, confirming unusually strong participation near $100.44. Meanwhile, the long/short ratio is 2.25 and funding is 0.0100%, indicating crowded long positioning that could amplify volatility if $98.79 fails.
Technical Indicators
Trade Setup
Scenario Analysis
Bullish Case
Trigger: Break and hold above $106.76 with volume remaining above 2.0x average
Target: $115.24
Invalidation: $102.00
A move above $106.76 would clear Pivot R1 while the 2.24x volume ratio supports continuation from $100.44. The $4.24 ATR implies an initial expansion target near $115.24 if momentum persists above $106.76.
Base Case
Trigger: Price holds $98.79 while failing to establish a sustained break above $106.76
Target: $98.79-$106.76
Invalidation: Daily close below $98.79
SOL could consolidate between $98.79 and $106.76 as RSI remains elevated at 88.7 and traders absorb the recent move. The 0.0100% funding rate and 2.25 long/short ratio favor a crowded-long range rather than immediate upside expansion.
Bearish Case
Trigger: Break below $98.79 followed by sustained selling volume above the 2.24x average-volume reading
Target: $90.31-$93.43
Invalidation: Recovery above $106.76
A break below $98.79 would signal rejection of the upper Bollinger Band while RSI at 88.7 leaves substantial room for mean reversion. The $4.24 ATR points to approximately $94.55 after one ATR of downside from $98.79, with deeper pressure potentially reaching $90.31.
Analysis Summary
Solana (SOL) Resources