Bitcoin (BTC) Interactive Chart Analysis — August 14, 2026
BTC at $62,900 — interactive chart with EMA, BB, RSI, MACD, S/R levels. WEAK bearish signal (-35). Funding rate 0.0041%.
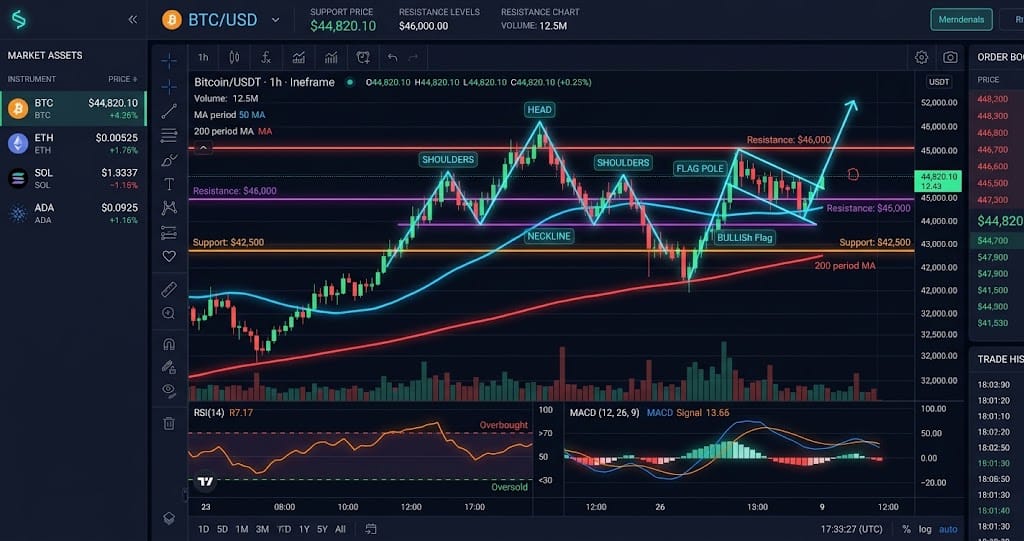
Interactive chart — switch timeframes, toggle indicators, hover for OHLC data
Market Structure
BTC is trading at $62,900 with a weak bearish bias.
Key Levels
| Price | Type | Source | Significance | Distance |
|---|---|---|---|---|
| $67,479 | Resistance | Pivot R3 | Low | +7.3% |
| $66,483 | Resistance | Pivot R2 | Medium | +5.7% |
| $65,515 | Resistance | BB Upper | Low | +4.2% |
| $64,692 | Resistance | Pivot R1 | Medium | +2.8% |
| $62,900 | Current | — | — | — |
| $62,535 | Support | BB Lower | Low | -0.6% |
| $61,904 | Support | Pivot S1 | Medium | -1.6% |
| $60,908 | Support | Pivot S2 | Medium | -3.2% |
| $59,117 | Support | Pivot S3 | Low | -6.0% |
Moving Averages
| MA | Value | Position | Signal |
|---|---|---|---|
| EMA 20 | $64,135 | Below | Bearish |
| EMA 50 | $64,471 | Below | Bearish |
| EMA 200 | $72,354 | Below | Bearish |
| BB Middle (SMA 20) | $64,025 | Below | Bearish |
Volume Analysis
Volume is at 0.62x the 20-day average, indicating normal activity.
Technical Indicators
Trade Setup
Scenario Analysis
Bullish Case
Trigger: N/A
Target: N/A
Invalidation: N/A
Base Case
Trigger: Price holds within the $61,000–$63,000 range on declining volume, with no clear breakout after 3 daily closes.
Target: $61,500 – $62,500 (range-bound oscillation)
Invalidation: A daily close above $63,500 or below $60,500, signaling a definitive directional shift.
The base case anticipates continued consolidation as short-term momentum fades and order books thin out between major liquidity clusters. This sideways grind will likely persist until a macro catalyst (e.g., Fed news or large whale movement) forces a breakout from the established equilibrium.
Bearish Case
Trigger: A high-volume daily close below the critical support level of $60,000, accompanied by a rising put/call ratio.
Target: ** $57,000 (next major weekly demand zone)
Invalidation: Price recaptures and holds above $60,500 within the next two trading sessions, negating the breakdown.
** The bearish scenario unfolds if bulls fail to defend the $60,000 psychological floor, triggering a cascade of long liquidations and stop-loss hunting toward the $57,000 support. This downside move would likely be swift but short-lived unless followed by sustained selling pressure, with invalidation requiring an immediate reclaim of the broken level to trap late shorts.
Analysis Summary
Bitcoin (BTC) Resources