Solana (SOL) Interactive Chart Analysis — August 14, 2026
SOL at $75.82 — interactive chart with EMA, BB, RSI, MACD, S/R levels. WEAK bullish signal (20). Funding rate 0.0012%.
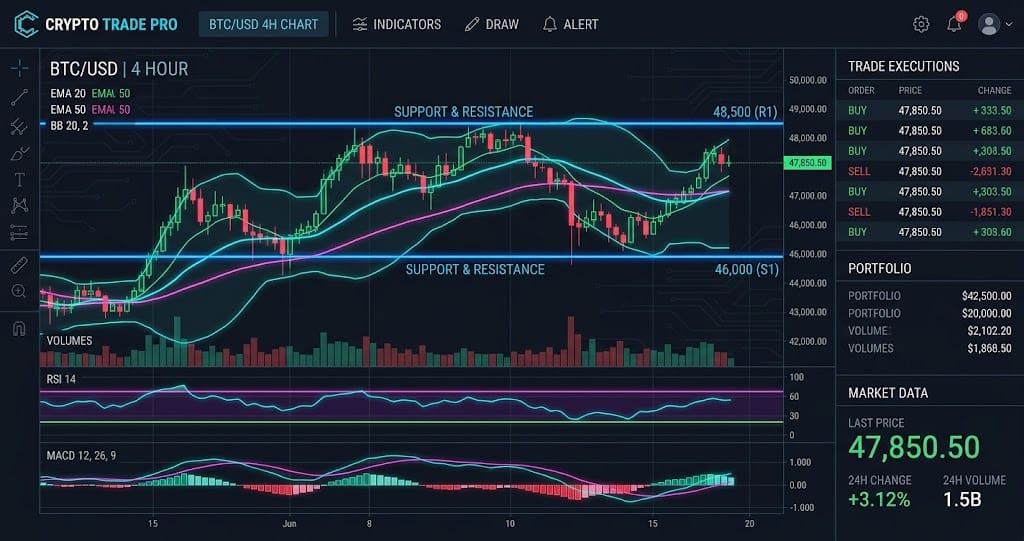
Interactive chart — switch timeframes, toggle indicators, hover for OHLC data
Market Structure
SOL trades at $75.82, with a weak bullish signal of 20 and RSI at 52.4 as of August 14, 2026. Price is above EMA20 at $75.31 and EMA50 at $75.60, while BB %B at 73.4% shows price is in the upper half of its Bollinger Band range. The bullish structure remains valid above $75.31, with $77.55 as the next resistance.
Key Levels
| Price | Type | Source | Significance | Distance |
|---|---|---|---|---|
| $91.02 | Resistance | EMA200 | High | +20.0% |
| $80.73 | Resistance | Pivot R3 | Low | +6.5% |
| $79.27 | Resistance | Pivot R2 | Medium | +4.6% |
| $77.55 | Resistance | Pivot R1 | Medium | +2.3% |
| $75.82 | Current | — | — | — |
| $75.31 | Support | EMA20 | Low | -0.7% |
| $74.37 | Support | Pivot S1 | Medium | -1.9% |
| $72.91 | Support | Pivot S2 | Medium | -3.8% |
| $72.08 | Support | BB Lower | Low | -4.9% |
Moving Averages
| MA | Value | Position | Signal |
|---|---|---|---|
| EMA 20 | $75.31 | Above | Bullish |
| EMA 50 | $75.60 | Above | Bullish |
| EMA 200 | $91.02 | Below | Bearish |
| BB Middle (SMA 20) | $74.63 | Above | Bullish |
Volume Analysis
Volume is only 0.42x the average, so the $75.82 price is not backed by strong participation as of August 14, 2026. Funding is mildly positive at 0.0012%, while the 1.62 long/short ratio shows longs outweigh shorts, increasing the risk of a long squeeze if $75.31 fails. A move above $77.55 needs volume to rise materially above 0.42x average to confirm continuation.
Technical Indicators
Trade Setup
Scenario Analysis
Bullish Case
Trigger: SOL closes above $77.55 with volume rising above 1.00x average.
Target: $79.58, based on one ATR of $2.03 above the $77.55 breakout level.
Invalidation: A close below $75.31.
Base Case
Trigger: SOL holds $75.31 while remaining below $77.55.
Target: $75.31-$77.55 range, with RSI remaining near 52.4.
Invalidation: A decisive close outside the $75.31-$77.55 range.
Bearish Case
Trigger: SOL closes below $75.31 with volume expanding above 0.42x average.
Target: $73.28, equal to $75.31 minus the $2.03 ATR.
Invalidation: A recovery above $77.55.
Analysis Summary
Solana (SOL) Resources