Solana (SOL) Interactive Chart Analysis — August 13, 2026
SOL at $76.05 — interactive chart with EMA, BB, RSI, MACD, S/R levels. WEAK bullish signal (10). Funding rate 0.0035%.
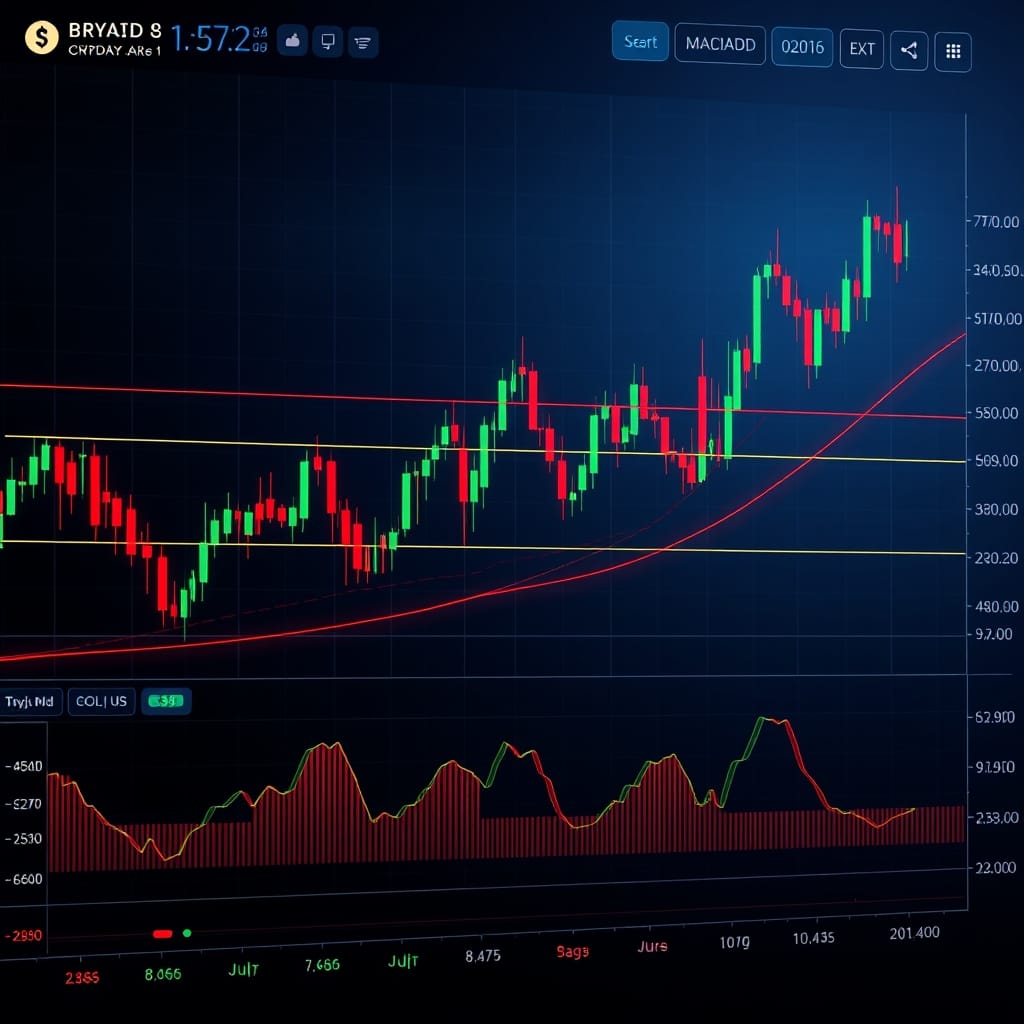
Interactive chart — switch timeframes, toggle indicators, hover for OHLC data
Market Structure
SOL is mildly bullish at $76.05, with price above EMA20 at $75.33 and EMA50 at $75.61 while RSI sits at 53.2; CoinDCX data on August 13, 2026 also shows SOL reclaiming its 20-day and 50-day EMAs. The structure remains a recovery rather than a confirmed breakout because resistance is $77.70 and price is only $0.44 below it; a close above $77.70 would strengthen the bullish trend. CoinDCX +1
Key Levels
| Price | Type | Source | Significance | Distance |
|---|---|---|---|---|
| $91.25 | Resistance | EMA200 | High | +20.0% |
| $80.88 | Resistance | Pivot R3 | Low | +6.4% |
| $79.35 | Resistance | Pivot R2 | Medium | +4.3% |
| $77.70 | Resistance | Pivot R1 | Medium | +2.2% |
| $76.05 | Current | — | — | — |
| $75.33 | Support | EMA20 | Low | -0.9% |
| $74.52 | Support | Pivot S1 | Medium | -2.0% |
| $72.99 | Support | Pivot S2 | Medium | -4.0% |
| $71.34 | Support | Pivot S3 | Low | -6.2% |
Moving Averages
| MA | Value | Position | Signal |
|---|---|---|---|
| EMA 20 | $75.33 | Above | Bullish |
| EMA 50 | $75.61 | Above | Bullish |
| EMA 200 | $91.25 | Below | Bearish |
| BB Middle (SMA 20) | $74.56 | Above | Bullish |
Volume Analysis
Volume is the main weakness, running at only 0.48x average despite the positive MACD histogram and 53.2 RSI. The bullish signal therefore lacks strong participation, and SOL needs volume to expand materially above its current 0.48x average level for a breakout above $77.70 to carry stronger confirmation.
Technical Indicators
Trade Setup
Scenario Analysis
Bullish Case
Trigger: Daily close above $77.70 with volume rising above 1.0x average
Target: $81.00
Invalidation: Daily close below $75.33
SOL can extend its recovery if $77.70 breaks with stronger volume, with the $2.09 ATR supporting room for a move toward $81. CoinDCX identifies $78.44 as a major near-term resistance and projects $82-$85 after a confirmed break, so $81 is the first measurable bullish target. CoinDCX
Base Case
Trigger: Price holds $75.33-$77.70 while volume remains below 1.0x average
Target: $75.33-$77.70
Invalidation: Daily close below $75.33 or above $77.70 with volume above 1.0x average
The highest-probability setup is consolidation because RSI is only 53.2 and volume is just 0.48x average, limiting evidence for a decisive trend move. SOL should remain between $75.33 and $77.70 while neither support nor resistance breaks with volume confirmation.
Bearish Case
Trigger: Daily close below $75.33 with RSI falling below 50
Target: $73.25-$74.00
Invalidation: Daily close above $77.70
The bearish case starts if SOL loses its EMA20 at $75.33 and momentum drops below the neutral RSI level of 50. A move toward $73.25-$74.00 becomes plausible, while the August 13 market analysis identifies the $75.44 area as key support and $72.27 as the next downside reference. CoinDCX
Analysis Summary
Solana (SOL) Resources