BTC at $73,183 — Daily Crypto Technical Analysis (May 28, 2026)
Market Overview
Total crypto market cap fell 3.3% to $2.54 trillion as of May 28, 2026. The Fear & Greed Index sits at 22 (Extreme Fear). According to CoinMarketCap data, that reading has not appeared since August 2025. Bitcoin dominance stands at 57.7%, up 1.2 percentage points over the past 7 days.
Bitcoin (BTC) — $73,183
● CONFLICTED NEUTRAL (Score: 2)
Price Action & Key Levels
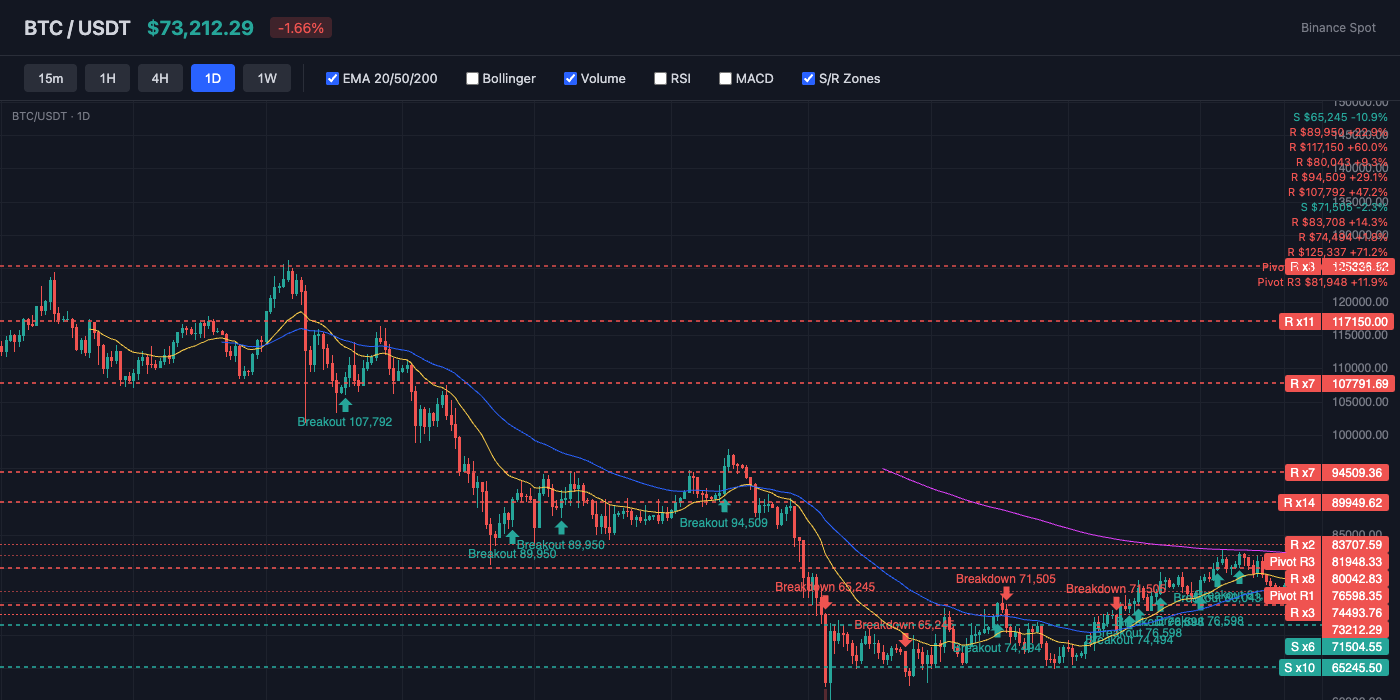
Bitcoin trades at $73,183, currently below the 20-day EMA ($77,240) and below the 50-day EMA ($76,522). The 200-day EMA at $83,699 serves as long-term resistance. Key resistance sits at $73,519 (BB Lower), while support holds at $71,248 (Pivot S1). EMA alignment is mixed, suggesting a transitional or ranging market.
Bollinger Bands & Volatility
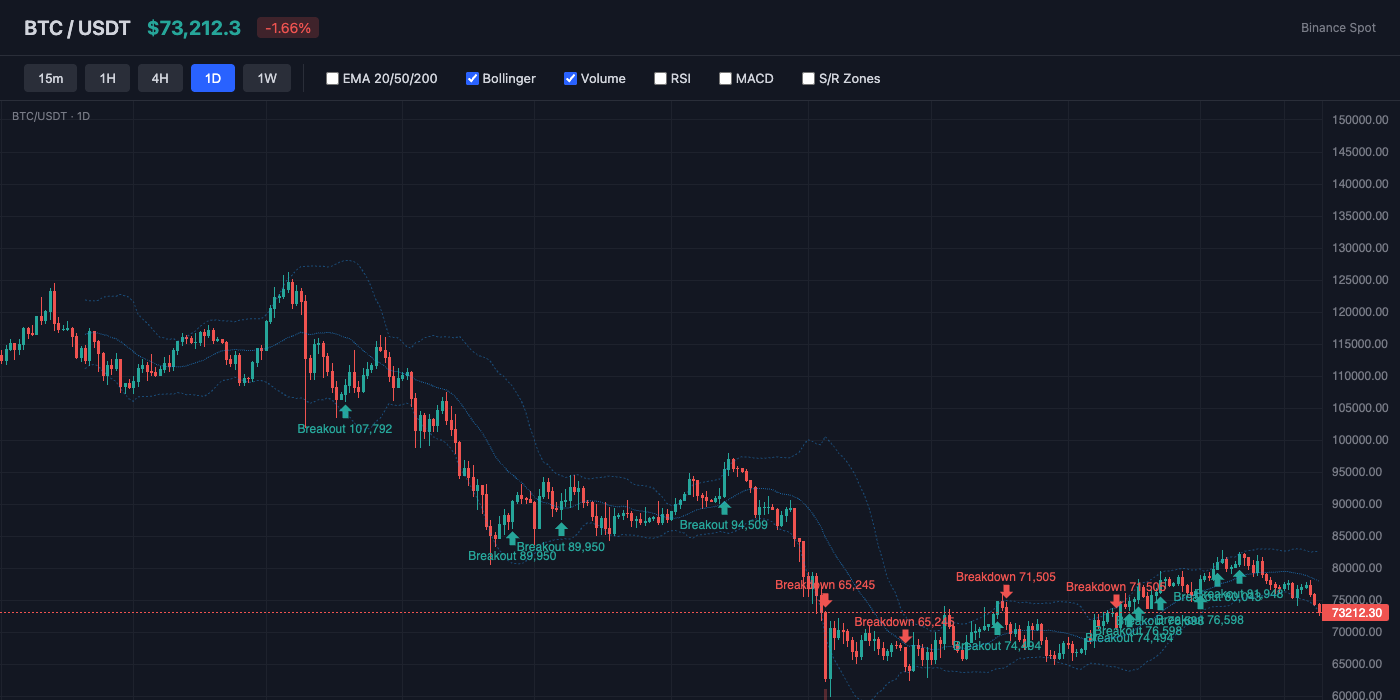
Bollinger Bands show a bandwidth of 11.3% (moderate volatility). Price hugs the lower band (%B: -4%), indicating oversold conditions or persistent selling. The middle band (SMA 20) at $77,915 acts as dynamic resistance.
Momentum Indicators
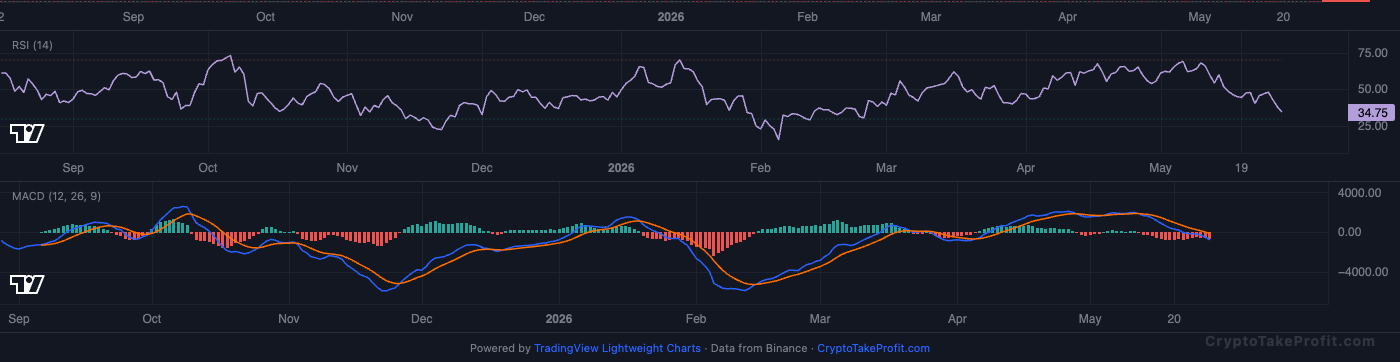
RSI reads 35.9, showing bearish pressure but approaching oversold. MACD has no active crossover, with negative histogram (-562.88) indicating downward pressure.
Market Structure
BTC is trading at $73,183 with a conflicted neutral bias.
Volume Analysis
Volume is at 0.91x the 20-day average, indicating normal activity.
Key Levels
| Price | Type | Source | Significance | Distance |
|---|---|---|---|---|
| $81,948 | Resistance | Pivot R3 | Low | +12.0% |
| $80,014 | Resistance | Pivot R2 | Medium | +9.3% |
| $76,598 | Resistance | Pivot R1 | Medium | +4.7% |
| $73,519 | Resistance | BB Lower | Low | +0.5% |
| $73,183 | Current | — | — | — |
| $71,248 | Support | Pivot S1 | Medium | -2.6% |
| $69,314 | Support | Pivot S2 | Medium | -5.3% |
| $65,898 | Support | Pivot S3 | Low | -10.0% |
Moving Averages
| MA | Value | Position | Signal |
|---|---|---|---|
| EMA 20 | $77,240 | Below | Bearish |
| EMA 50 | $76,522 | Below | Bearish |
| EMA 200 | $83,699 | Below | Bearish |
| BB Middle (SMA 20) | $77,915 | Below | Bearish |
Trade Setup
BTC Scenario Analysis
Bullish Case
Trigger: N/A
Target: N/A
Invalidation: N/A
Base Case
Trigger: N/A
Target: N/A
Invalidation: N/A
Bearish Case
Trigger: N/A
Target: N/A
Invalidation: N/A
Bitcoin (BTC) Resources
Altcoin Overview
Among altcoins, BNB leads with the strongest bearish signal (score: -10), while AVAX shows the weakest setup (score: -21). Traders should focus on coins with clear directional signals and volume confirmation.
What to Watch
- BTC holding
- 73,183withRSI35.9;adropbelow71,000 would confirm bearish momentum per TradingView data.
- 1,986(RSI30.8);oversoldbouncepossibleif1,950 holds based on Binance order books.
- 80withHangingManpatternondailychart;Coinglassdatashows8.40 as critical support.
- BNB score -10 (weak bearish) at