Bitcoin's Record 67-Day Negative Funding Streak and June 2026 Liquidation Risk
BTC's 67-day negative funding streak ended June 1, 2026. USD 526M liquidated in one hour. June 26 expiry carries USD 8.5–9B notional, max pain USD
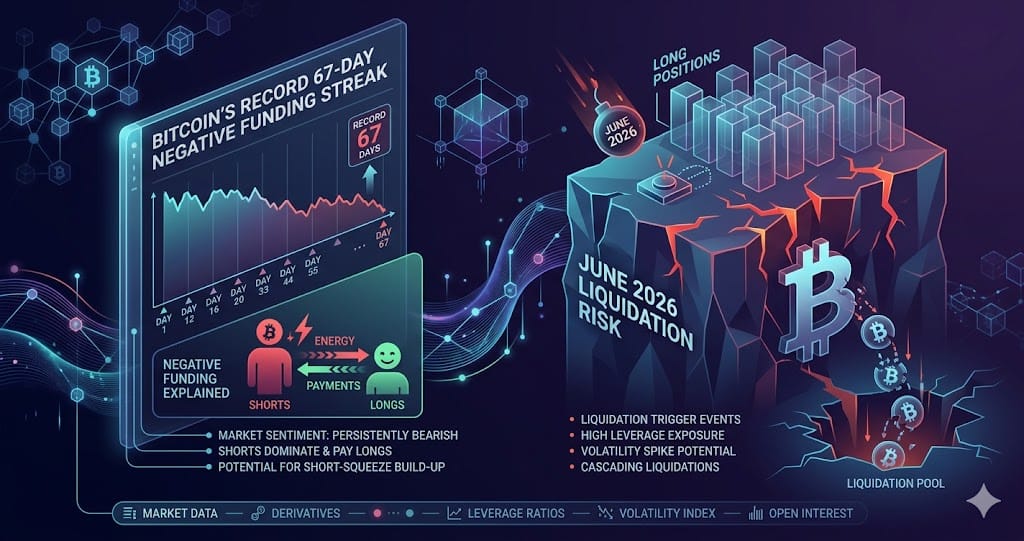
Bitcoin's perpetual futures recorded a 67-day consecutive negative funding rate streak ending in late May 2026, the longest in nearly 10 years and longer than the roughly 50-day negative stretch that followed the FTX collapse in November 2022. By June 1, funding had flipped to a faint positive of 0%–10% annualized across major venues including Binance, OKX, and Bybit.
That structural shift came after a severe deleveraging sequence: open interest across 11 exchanges fell from a peak above USD 90B in October 2025 to a six-month low of USD 25B in May 2026. A single hour of trading near the USD 77,000–80,000 resistance zone produced USD 526M in liquidations, USD 510M of which were long positions. The next critical date is June 26, when roughly USD 8.5B–9B in options notional expires across Deribit, Binance, and OKX, with max pain sitting at USD 77,500 — 5.3% above the June 1 spot price of USD 73,600.
The USD 526M Single-Hour Liquidation Event
On the day BTC repeatedly tested the USD 79,000–80,000 resistance zone and failed, the rejection triggered a slide through USD 77,000 that liquidated USD 526M in one hour. Of that total, USD 510M was long positions — a concentration that reflects how crowded the bullish side had become near that technical ceiling. Multiple data providers including Phemex and MEXC attributed the event entirely to technical resistance failure plus leverage overload, with no new macro catalyst present.
That distinguishes this event from earlier cascades in the same cycle, which were sparked by external shocks such as a U.S. military strike on Iran and the 10-year Treasury yield breaking 5.1%. The May 2026 single-hour liquidation confirms that cascades can now ignite from internal market structure alone — a failed breakout attempt is sufficient when funding and positioning are sufficiently one-sided.
The broader weekend window saw long liquidations reported north of USD 800M, consistent with earlier estimates near USD 897M. Daily liquidations as of June 1 have fallen back to USD 130.61M per 24 hours and USD 15.60M per hour, roughly one-seventh of the USD 958.8M cascade peak recorded during the most acute deleveraging phase.
Open Interest Collapse: From USD 90B to USD 25B
Bitcoin futures open interest peaked above USD 90B in October 2025. By the end of May 2026 it touched USD 25B, a six-month low and a decline of more than 70%. The current reading of approximately USD 42.6B across 11 exchanges — where Binance holds a 19.14% share and CME holds 13.88% — represents a partial recovery from that trough but remains far below the cycle high.
The contraction was not limited to one venue. CME, offshore perpetuals on centralized exchanges, and on-chain perpetual DEXs all shrank simultaneously, ruling out a single-platform explanation. The cash-and-carry basis compressed from roughly 12% annualized to 4%–5%, and the three-month basis stood at only 2.8% annualized as of June 1, up fractionally from 2.2% the prior week. Carry traders who had extracted double-digit returns from basis arbitrage have largely exited.
Funding rates reinforced the same picture: from persistently positive in early May, to neutral, to negative through the 67-day streak, before turning faintly positive again on June 1. When OI falls and funding turns negative simultaneously, it signals that speculative long leverage has been forcibly unwound and new short positions are being established at current prices — a structural reset rather than a temporary pause.
The 67-Day Negative Funding Streak and What History Suggests
From approximately mid-March to late May 2026, BTC perpetual funding rates spent 67 consecutive days below zero on a 30-day moving average basis. That surpasses the roughly 50-day negative stretch observed after the FTX collapse in November 2022, when BTC traded below USD 16,000. Negative funding means short traders collect payments from longs, reflecting a market that is structurally biased toward the downside in leveraged positioning.
Historical backtesting across six comparable negative funding rate periods since 2018 shows that all six ended with positive price returns over the following 90 days, with a win rate of 83%–96% depending on the exact entry window. The current setup — negative funding just flipping positive, combined with rising OI from the trough — matches the early recovery phase of that historical pattern. However, the June 1 positive reading is fragile: 0%–10% annualized is far below the January 2026 peak above 70% APR, and the options put-to-call volume ratio still sits at 61% put versus 39% call, indicating traders are still paying for downside protection.
CME put open interest has exceeded call open interest every month since November 2025, even as BTC recovered from February lows. That persistent institutional hedging posture means dealer gamma exposure is skewed toward amplifying downside moves near key levels — a structural risk factor that the funding rate data alone does not capture.
June 26 Expiry: The Next High-Stakes Settlement Date
The June 26, 2026 options expiry across Deribit, Binance, and OKX is the largest single settlement date in the current options cycle, with notional value estimated between USD 8.5B and USD 9B. The max pain level — the strike price at which the aggregate value of expiring options is minimized for buyers — sits at USD 77,500, approximately 5.3% above the June 1 spot price of USD 73,600.
Binance's near-term max pain falls in the USD 76,000–78,000 range, but for the June 26 contract specifically, max pain climbs toward USD 80,000. If spot fails to recover toward these levels before expiry, a large volume of call open interest will expire worthless. Dealer hedging adjustments in the days approaching June 26 could amplify price moves in either direction as positions are unwound.
The May 29 monthly expiry was the previous major settlement checkpoint; June 26 is the next. Against a backdrop of over USD 2.3B in net outflows from U.S. spot BTC ETFs during May 2026 — including a 10-day consecutive outflow streak totaling USD 2.97B — and the CME put-over-call structure intact since November 2025, the path from current spot to max pain faces material headwinds.
What to Watch
- June 26 cross-exchange options expiry: USD 8.5B–9B notional with max pain at USD 77,500, while BTC spot sat at USD 73,600 on June 1 — a 5.3% gap the market must close
- BTC futures OI trajectory: the current USD 42.6B is a recovery from the USD 25B six-month trough but still less than half the October 2025 peak of USD 90B+
- CME put open interest has continuously exceeded call open interest since November 2025, signaling institutional hedges remain entrenched even after the partial spot recovery
- Daily liquidation levels: USD 130.61M per 24 hours as of June 1 versus the cascade peak of USD 958.8M — the low-volatility window persists but the June 26 expiry and the spot-to-max-pain gap are the next potential catalysts
Ready to start trading?
Trade on Bitget Try CoinTech2uAffiliate links — we may earn a commission at no extra cost to you.
Related Articles
- 2026 Crypto Narratives: Capital Is Rotating, Not Retreating
- Crypto Liquidations May 2026: USD 657M Wiped and What Comes Next
- Crypto Market Week in Review: Key Narratives for Late May 2026
Frequently Asked Questions
What does a negative funding rate mean in Bitcoin perpetual futures?
In perpetual futures markets, the funding rate is a periodic payment exchanged between long and short traders to anchor the contract price to spot. When funding is negative, short traders receive payments from longs, reflecting bearish dominance in leveraged positioning. BTC sustained this condition for 67 consecutive days from roughly mid-March to late May 2026 — the longest such streak in nearly 10 years, exceeding the approximately 50-day negative run that followed the FTX collapse when BTC was trading below USD 16,000.
What is max pain in Bitcoin options and why does it matter near expiry?
Max pain is the strike price at which the combined value of expiring call and put options is lowest for buyers, meaning option sellers — typically market makers and dealers — benefit most if spot settles there. For the June 26, 2026 expiry, max pain is USD 77,500 across the major venues. As expiry approaches, dealer hedging activity can pull spot toward this level. If spot remains well below it, as it did at USD 73,600 on June 1, large volumes of call open interest expire worthless and short-dated volatility tends to spike around the settlement date.
Does the current low liquidation level mean the worst is over for BTC?
Current 24-hour liquidations of USD 130.61M are about one-seventh of the USD 958.8M cascade peak, which indicates the most acute forced deleveraging phase has passed. However, low liquidations in a post-cascade environment often reflect depleted leverage rather than a healthy market. The USD 5.3% gap between spot and max pain for the June 26 expiry, persistent CME institutional put hedging since November 2025, and ongoing U.S. spot ETF outflows totaling over USD 2.3B in May 2026 all represent risk factors that could re-ignite volatility before the end of June.