Crypto in Extreme Fear (12) — BTC at $62,684 Technical Analysis
Market Overview
The crypto market advanced with total capitalization at $2.23T (+1.1%). BTC dominance sits at 56.3% while the Fear & Greed Index reads 12 (Extreme Fear), reflecting cautious sentiment.
Bitcoin (BTC) — $62,684
● CONFLICTED NEUTRAL (Score: -18)
Price Action & Key Levels
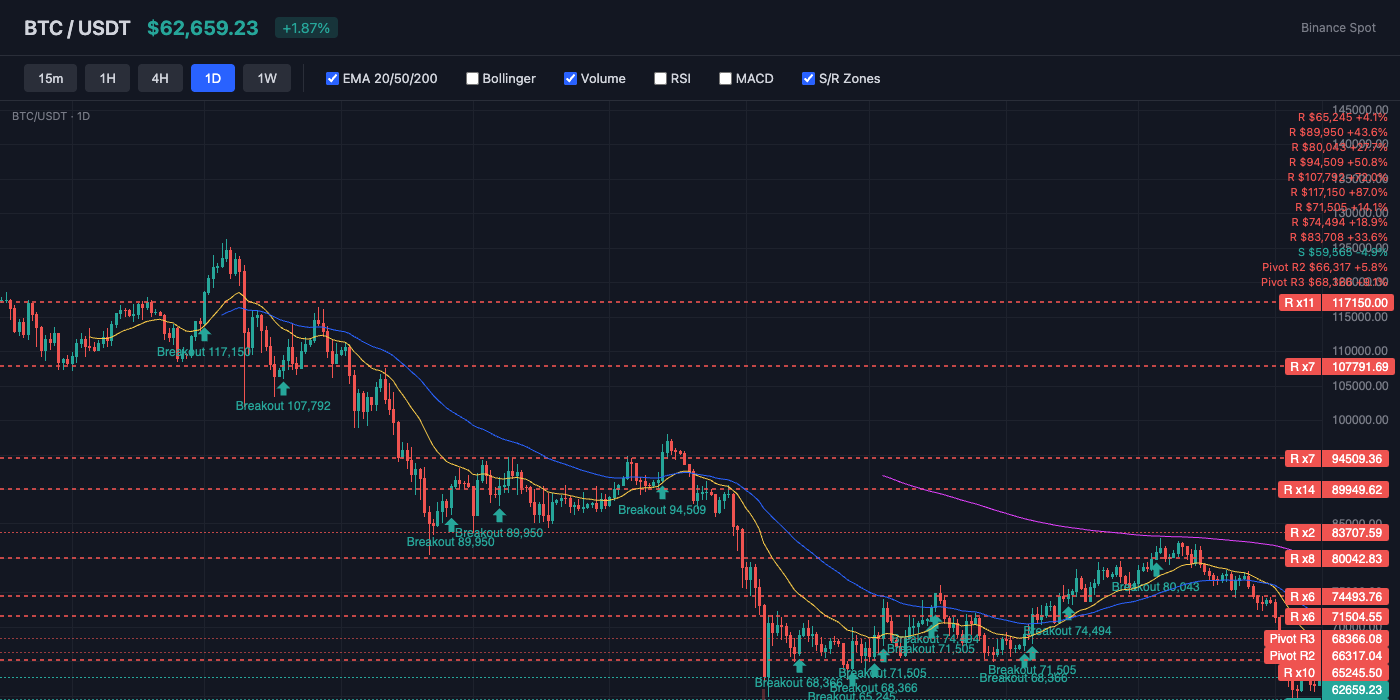
Bitcoin trades at $62,684, currently below the 20-day EMA ($67,773) and below the 50-day EMA ($71,702). The 200-day EMA at $81,670 serves as long-term resistance. Key resistance sits at $64,501 (Pivot R1), while support holds at $60,635 (Pivot S1). EMAs are stacked bearishly (20 < 50 < 200), indicating a sustained downtrend.
Bollinger Bands & Volatility
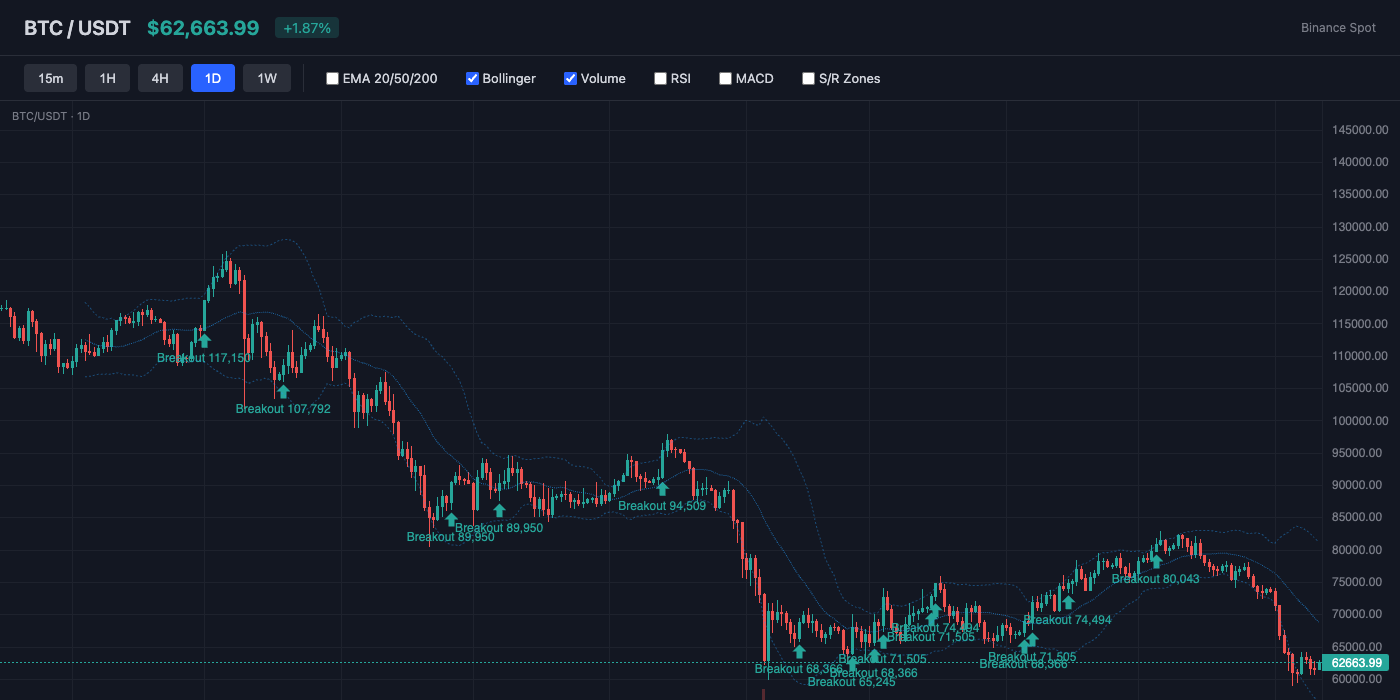
Bollinger Bands show a bandwidth of 35.6% (wide expansion — high volatility in play). Price is near the middle of the bands (%B: 25%), showing balanced positioning. The middle band (SMA 20) at $68,881 acts as dynamic resistance.
Momentum Indicators
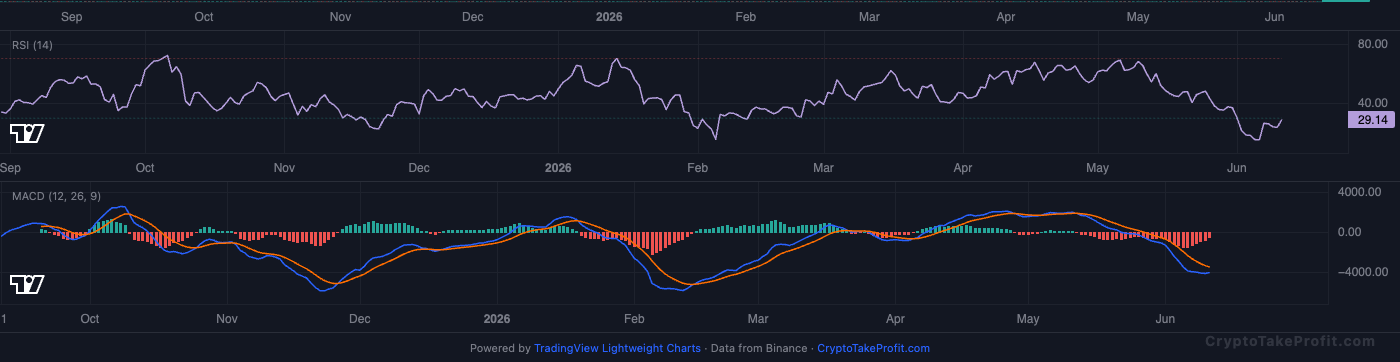
RSI reads 32.2, showing bearish pressure but approaching oversold. MACD has no active crossover, with negative histogram (-532.69) indicating downward pressure.
Market Structure
BTC trades at $62,684 while remaining below the EMA20 at $67,773 and EMA50 at $71,702, which keeps the broader trend bearish despite the neutral aggregate signal of -18. RSI at 32.2 and Fear & Greed at 12 show deeply pessimistic sentiment, while the Doji pattern near support suggests indecision rather than confirmed continuation.
Volume Analysis
Volume is only 0.34x average, indicating weak participation behind recent price action and limited conviction from either buyers or sellers. The negative MACD histogram supports bearish momentum, but low volume reduces the probability of an immediate directional breakout and increases the likelihood of choppy trading around key levels.
Key Levels
| Price | Type | Source | Significance | Distance |
|---|---|---|---|---|
| $71,702 | Resistance | EMA50 | Medium | +14.4% |
| $68,366 | Resistance | Pivot R3 | Low | +9.1% |
| $66,317 | Resistance | Pivot R2 | Medium | +5.8% |
| $64,501 | Resistance | Pivot R1 | Medium | +2.9% |
| $62,684 | Current | — | — | — |
| $60,635 | Support | Pivot S1 | Medium | -3.3% |
| $58,586 | Support | Pivot S2 | Medium | -6.5% |
| $56,770 | Support | Pivot S3 | Low | -9.4% |
Moving Averages
| MA | Value | Position | Signal |
|---|---|---|---|
| EMA 20 | $67,773 | Below | Bearish |
| EMA 50 | $71,702 | Below | Bearish |
| EMA 200 | $81,670 | Below | Bearish |
| BB Middle (SMA 20) | $68,881 | Below | Bearish |
Trade Setup
BTC Scenario Analysis
Bullish Case
Trigger: Daily close above $64,501 with volume expanding above recent averages
Target: $67,773
Invalidation: Close below $60,635
RSI at 32.2 and Fear & Greed at 12 create conditions for a relief rally if buyers reclaim resistance at $64,501. Positive funding of 0.0024% and a long/short ratio of 1.13 show traders are not aggressively positioned short, allowing a move toward the EMA20 at $67,773.
Base Case
Trigger: Price remains between $60,635 and $64,501 while volume stays below 1.0x average
Target: $61,000-$64,500 range
Invalidation: Decisive breakout above $64,501 or breakdown below $60,635
The combination of a Doji candle, neutral signal score of -18, and volume at just 0.34x average supports consolidation rather than trend expansion. ATR of $2,529 suggests volatility remains elevated, but low participation favors range-bound trading between support and resistance.
Bearish Case
Trigger: Daily close below $60,635 support
Target: $58,100
Invalidation: Recovery above $64,501
Trading below both the EMA20 at $67,773 and EMA50 at $71,702 keeps sellers in control of the higher-timeframe structure. A break under $60,635 would confirm support failure, and the negative MACD histogram increases the risk of continuation toward the $58,100 area.
Bitcoin (BTC) Resources
Altcoin Overview
Among altcoins, ETH leads with the strongest neutral signal (score: -15), while BNB shows the weakest setup (score: -40). Traders should focus on coins with clear directional signals and volume confirmation.
What to Watch
- BTC action around $62,684 for directional confirmation
- Fear & Greed at 12 for sentiment shift signals
- MACD crossover follow-through on top altcoins
- Volume confirmation on any support/resistance breaks
- BTC dominance at 56.3% for alt rotation signals