Ethereum (ETH) Interactive Chart Analysis — August 26, 2026
ETH at $2,452 — interactive chart with EMA, BB, RSI, MACD, S/R levels. CONFLICTED neutral signal (15). Funding rate 0.0087%.
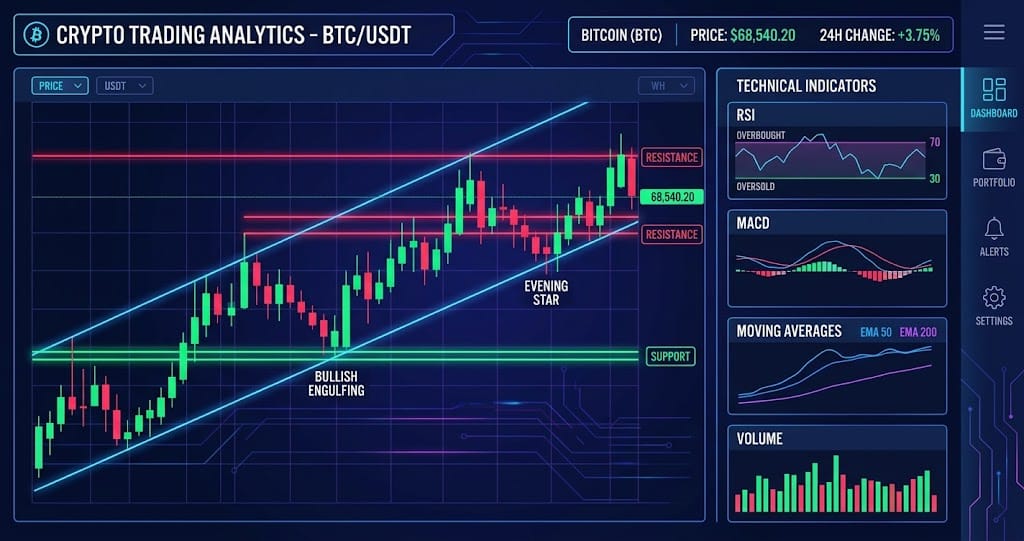
Interactive chart — switch timeframes, toggle indicators, hover for OHLC data
Market Structure
$2,452 keeps ETH in a strong short-term uptrend as of August 26, 2026, with price $276 above EMA20 at $2,176 and $438 above EMA50 at $2,014, according to the supplied indicators. RSI at 82.7 and BB %B at 85.7% show stretched momentum, while the signal score of 15 remains conflicted neutral.
Key Levels
| Price | Type | Source | Significance | Distance |
|---|---|---|---|---|
| $2,738 | Resistance | Pivot R3 | Low | +11.7% |
| $2,643 | Resistance | Pivot R2 | Medium | +7.8% |
| $2,596 | Resistance | BB Upper | Low | +5.9% |
| $2,547 | Resistance | Pivot R1 | Medium | +3.9% |
| $2,452 | Current | — | — | — |
| $2,356 | Support | Pivot S1 | Medium | -3.9% |
| $2,261 | Support | Pivot S2 | Medium | -7.8% |
| $2,165 | Support | Pivot S3 | Low | -11.7% |
| $2,014 | Support | EMA50 | Medium | -17.9% |
Moving Averages
| MA | Value | Position | Signal |
|---|---|---|---|
| EMA 20 | $2,176 | Above | Bullish |
| EMA 50 | $2,014 | Above | Bullish |
| EMA 200 | $2,157 | Above | Bullish |
| BB Middle (SMA 20) | $2,092 | Above | Bullish |
Volume Analysis
0.66x average volume shows the current move lacks strong participation as of August 26, 2026, according to the supplied volume data. That weak volume supports the uptrend less convincingly, making a clean break above the $2,547 resistance less confirmed unless volume rises toward or above 1.0x average.
Technical Indicators
Trade Setup
Scenario Analysis
Bullish Case
Trigger: Daily close above $2,547 with volume above 1.0x average
Target: $2,720
Invalidation: $2,356
A break above $2,547 would confirm continuation of the August 26, 2026 uptrend, with the $2,720 target extending the move by $173 from resistance. Funding at 0.0087% and a 1.71 long/short ratio show long positioning is already elevated, so the breakout needs stronger volume confirmation.
Base Case
Trigger: ETH remains between $2,356 and $2,547 without a confirmed breakout
Target: $2,400-$2,550
Invalidation: Daily close above $2,547 or below $2,356
The 0.66x volume ratio and 82.7 RSI favor consolidation as of August 26, 2026, while price remains above both EMA20 at $2,176 and EMA50 at $2,014. A range between $2,356 and $2,547 would allow overheated momentum to cool without immediately breaking the broader bullish structure.
Bearish Case
Trigger: Daily close below $2,356
Target: $2,176
Invalidation: Daily close above $2,547
Losing $2,356 would weaken the August 26, 2026 structure and expose EMA20 at $2,176 as the next major reference level, a $180 decline from support. The 82.7 RSI, 0.66x volume, and 1.71 long/short ratio increase the risk of a sharper unwind if crowded longs begin closing positions.
Analysis Summary
Ethereum (ETH) Resources