BTC at $78,974 Enters Overbought Zone (RSI 84) — TA Report
BTC at $78,974 (neutral) with chart analysis, futures data, and scenario breakdown. ETH, SOL, and top altcoins analyzed.
Market Overview
Total crypto market cap fell 4.2% to $2.67 trillion, according to CoinMarketCap data as of March 2026- . Bitcoin dominance sits at 59.3%, up from 58.1% last week. The Fear & Greed Index dropped to 65 (Greed) from 74 on Tuesday, signaling cooling optimism after a sharp rally- . BTC dominance rising while altcoins lag suggests capital is rotating back to Bitcoin.
Bitcoin (BTC) — $78,974
● CONFLICTED NEUTRAL (Score: 15)
Price Action & Key Levels
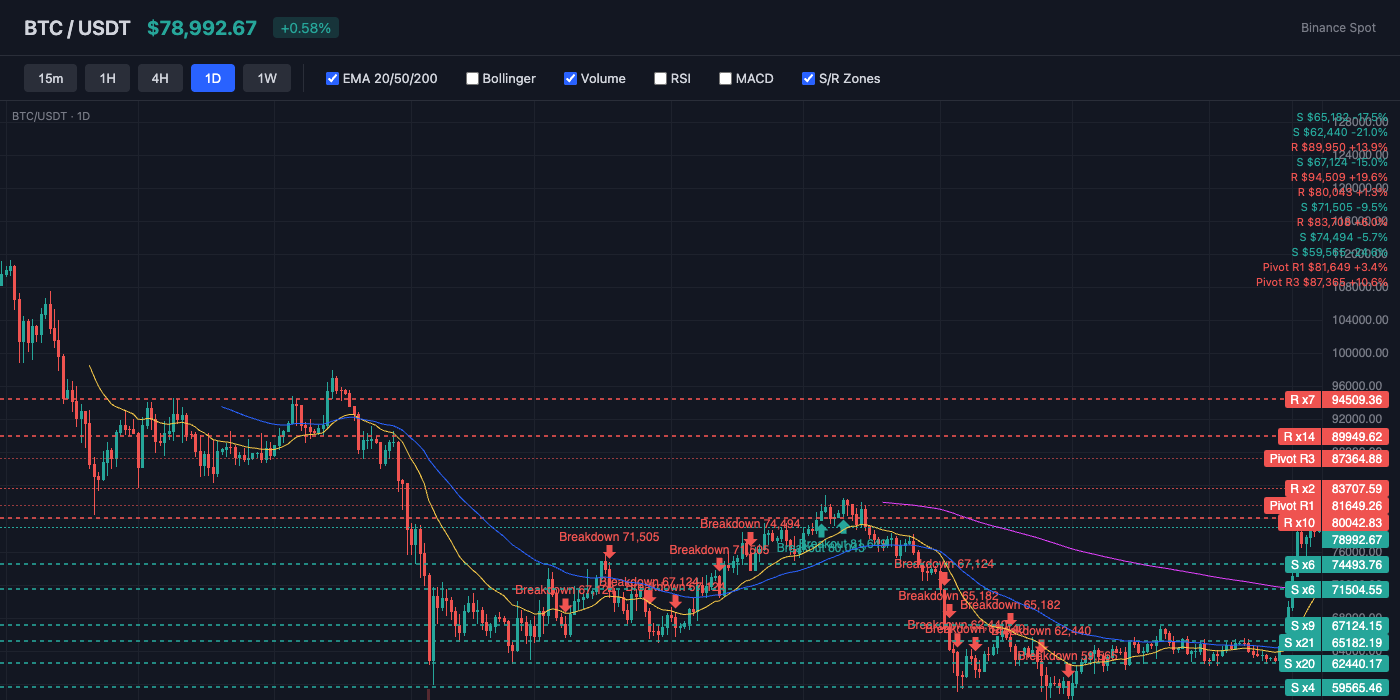
Bitcoin trades at $78,974, currently above the 20-day EMA ($71,115) and above the 50-day EMA ($67,708). The 200-day EMA at $71,811 serves as long-term support. Key resistance sits at $81,649 (Pivot R1), while support holds at $75,934 (Pivot S1). EMA alignment is mixed, suggesting a transitional or ranging market.
Bollinger Bands & Volatility
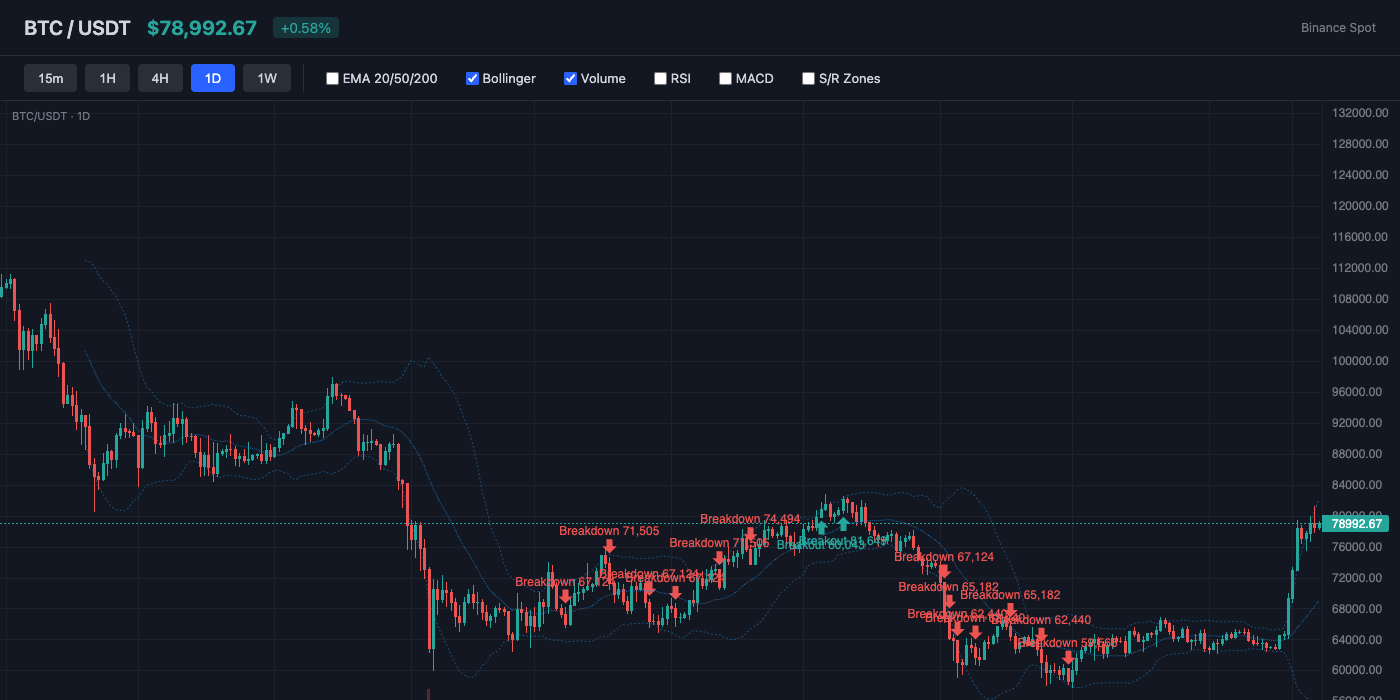
Bollinger Bands show a bandwidth of 37.3% (wide expansion — high volatility in play). Price sits near the upper band (%B: 89%), suggesting overbought conditions or strong bullish momentum. The middle band (SMA 20) at $68,912 acts as dynamic support.
Momentum Indicators
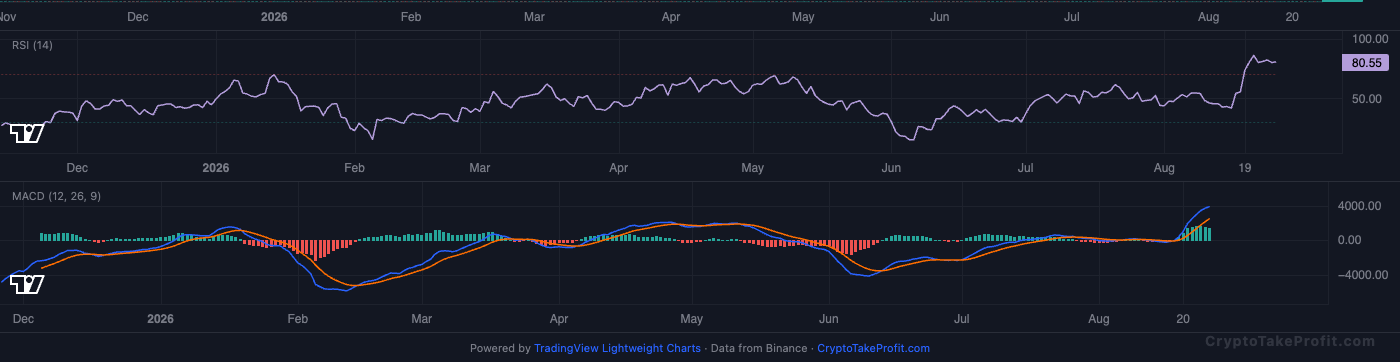
RSI reads 83.6, deep in overbought territory — a pullback or consolidation may follow. MACD has no active crossover, with positive histogram (1472.94) indicating upward momentum.
Market Structure
BTC is in a strong uptrend but is stretched, with price at $78,974 sitting $7,859 above EMA20 at $71,115 and $11,266 above EMA50 at $67,708, according to the provided BTC technical dataset as of August 26, 2026. RSI at 83.6 signals extreme momentum while the 15/100 conflicted signal and 89.1% Bollinger Band %B point to elevated pullback risk; the key structure range is $75,934 support versus $81,649 resistance.
Volume Analysis
Volume is not confirming the latest upside aggressively, with the provided data showing a 0.91x volume ratio versus average as of August 26, 2026. BTC therefore has room to test $81,649, but the 0.91x reading means a breakout above that level would need stronger participation to reduce the risk of a failed move.
Key Levels
| Price | Type | Source | Significance | Distance |
|---|---|---|---|---|
| $87,365 | Resistance | Pivot R3 | Low | +10.6% |
| $84,324 | Resistance | Pivot R2 | Medium | +6.8% |
| $81,649 | Resistance | Pivot R1 | Medium | +3.4% |
| $78,974 | Current | — | — | — |
| $75,934 | Support | Pivot S1 | Medium | -3.9% |
| $72,893 | Support | Pivot S2 | Medium | -7.7% |
| $71,115 | Support | EMA20 | Low | -10.0% |
| $70,218 | Support | Pivot S3 | Low | -11.1% |
Moving Averages
| MA | Value | Position | Signal |
|---|---|---|---|
| EMA 20 | $71,115 | Above | Bullish |
| EMA 50 | $67,708 | Above | Bullish |
| EMA 200 | $71,811 | Above | Bullish |
| BB Middle (SMA 20) | $68,912 | Above | Bullish |
Trade Setup
BTC Scenario Analysis
Bullish Case
Trigger: Daily close above $81,649 with volume rising above 1.00x average
Target: $85,500
Invalidation: $78,000
A break above the $81,649 Pivot R1 would confirm that buyers can extend the current move, while RSI at 83.6 shows momentum remains strong despite overbought conditions, according to the August 26, 2026 dataset. Funding at 0.0065% is positive but not extreme, while the 2.15 long/short ratio shows bullish positioning; a sustained close above $81,649 would target $85,500.
Base Case
Trigger: BTC holds $75,934 while failing to close decisively above $81,649
Target: $75,934-$81,649
Invalidation: Daily close below $75,934
The base case is consolidation between $75,934 and $81,649 as the market digests RSI at 83.6 and a 0.91x volume ratio, according to the August 26, 2026 technical data. Price remaining above EMA20 at $71,115 keeps the broader trend constructive, but the 15/100 conflicted signal favors range trading until BTC produces a confirmed breakout.
Bearish Case
Trigger: Daily close below $75,934
Target: $71,115-$72,000
Invalidation: Daily close above $81,649
A break below $75,934 would weaken the current structure and expose EMA20 at $71,115, with RSI at 83.6 leaving room for momentum to unwind, according to the August 26, 2026 dataset. The 2.15 long/short ratio also creates downside positioning risk if crowded longs begin closing, making $71,115 the primary bearish target.
Bitcoin (BTC) Resources
Altcoin Overview
Among altcoins, ADA leads with the strongest bullish signal (score: 23), while BNB shows the weakest setup (score: 10). Traders should focus on coins with clear directional signals and volume confirmation.
What to Watch
- BTC $78,974: RSI 83.6 overbought; watch $76,000 support for a potential pullback.
- ETH $2,465: RSI 84.8 extreme; failure above $2,500 could trigger a move to $2,350.
- SOL $97.00: $97 resistance since Jan 2026-
- ; close above $100 targets $109-
- BNB $699.80 with Doji pattern: $700 resistance in play-