How to Read Candlestick Charts — Beginner's Guide 2026
Learn reading candlestick charts for crypto trading with this beginner's guide. Step-by-step instructions, tips, and FAQ for crypto newcomers.

This guide walks you through reading candlestick charts for crypto trading step by step. Whether you're new to crypto or expanding your skills, we cover everything you need to get started safely and effectively.
In This Guide
- Step 1: Open a free charting platform
- Step 2: Identify the four prices on one candle
- Step 3: Read the color — green means up, red means down
- Step 4: Measure the body for strength
- Step 5: Look at the wicks for rejection
- Step 6: Spot the doji — the indecision candle
- Step 7: Recognize the engulfing pattern
- Step 8: Check volume under the chart
- Step 9: Read multiple candles in sequence
- Step 10: Apply the timeframe rule
- Tips and Best Practices
- FAQ
- A computer or smartphone with internet access
- A valid email address for account registration
- Basic understanding of cryptocurrency concepts
- A small amount of crypto or fiat currency to practice with
Step-by-Step Guide
Open a free charting platform
Open TradingView or the chart tab on Binance, Coinbase, or Kraken — these default to candlestick view. Pick a trading pair like BTC/USDT. TradingView logs over 1.5 million active chart sessions daily, per its own published metrics. Beginners often start on a 1-minute timeframe, which is a mistake. Candles form too fast at that resolution and mostly show noise, not signal. Set your chart to 4-hour or daily candles instead. Higher timeframes show clearer trends-
Identify the four prices on one candle
Every candle carries four numbers: Open, High, Low, and Close. Open is the first price of the period, Close is the last. High and Low mark the extremes in between. On May 8, 2026, Ethereum's daily candle showed an Open of $2,291, a High of $2,320, a Low of $2,265, and a Close of $2,306, according to Yahoo Finance data-
. That one candle captures the full range of that day's price action. A common mix-up: the Close isn't the current price — it's the price when the candle finished. Check which candle is still forming before you read it as final.
Read the color — green means up, red means down
A green (or white) candle means the Close landed higher than the Open — buyers won that period. A red (or black) candle means the Close landed lower than the Open. Sellers won-
. In March 2026, Bitcoin printed its first monthly green candle since September 2025, closing up roughly 1.84% after five straight red months, according to Bitget data-
. That one color shift signaled a potential trend change. Exchanges let you customize candle colors, so don't trust the color itself — compare Close to Open directly. If Close is higher, it's bullish no matter what shade your screen shows.
Measure the body for strength
The body is the thick block between Open and Close. A long body signals strong conviction; a short one signals hesitation-
. Bitcoin traded around $71,291 on April 9, 2026, up 6.08% over the prior month, and its daily candles showed long green bodies — buyers were in control, per Bitcoin Insider-
. A short body with long wicks means the market can't decide, and that pattern often shows up right before breakouts or reversals. Don't trade a long body on its own, though. Check whether volume backs the move — a long body on low volume is less reliable.
Look at the wicks for rejection
Wicks, also called shadows, are the thin lines above and below the body. They mark how far price traveled before getting pushed back-
. A long upper wick means price spiked and sellers shoved it back down. A long lower wick means price dropped and buyers pulled it back up-
. On April 23, 2026, Bitcoin's daily candle briefly broke bear flag resistance before pulling back, leaving an upper wick that signaled seller rejection, per KuCoin analysis-
. That wick told traders the breakout attempt had failed. A long lower wick at a known support level often means buyers are defending that price — a potential entry signal.
Spot the doji — the indecision candle
A doji has a tiny body: Open and Close sit almost equal. The wicks can run long or short-
. Neither buyers nor sellers controlled that period, and dojis often show up before trend changes. On May 7, 2026, Ethereum printed a doji on its daily chart, according to Investing.com pattern data-
. That signaled uncertainty after the prior move. A doji alone isn't a trade signal — you need the next candle to confirm it. If a doji follows a long uptrend and the next candle is red, that's a stronger reversal hint.
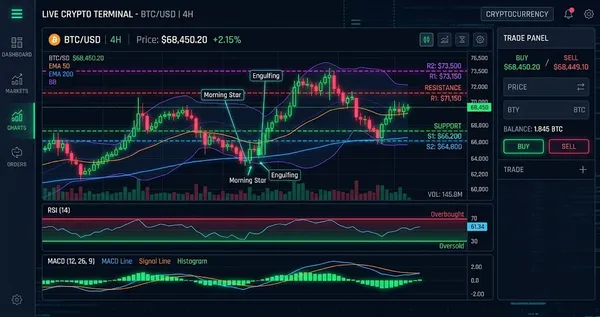
Recognize the engulfing pattern
A bullish engulfing pattern is a large green candle that fully covers the prior red candle's body. It shows buyers overwhelmed sellers-
. A bearish engulfing works the other way: a large red candle covers the prior green one-
. Research published on Gate.io in March 2026 found the bullish three-line strike pattern carries an 84% accuracy rate for predicting price increases, though results for individual engulfing patterns vary-
. Look for engulfing patterns at key support or resistance levels — a bullish engulfing at major support carries more weight than one sitting in the middle of a range. Wait for the candle to close before you trade it.
Check volume under the chart
Volume shows how many coins or contracts traded during that candle. Most charting platforms plot it as vertical bars below the price chart-
. The 2026 Q1 Crypto Industry Report put average daily trading volume across crypto at $117.8 billion for the quarter, down 27.2% from the prior one-
. High volume confirms a price move; low volume weakens it. A green breakout candle on rising volume is more trustworthy than one on shrinking volume. Two identical candlestick patterns can carry very different reliability depending on volume alone, so don't skip it.
Read multiple candles in sequence
One candle captures a moment. A sequence tells a story. A run of green candles shows strong bullish momentum; a run of red ones shows strong selling-
. When candles shrink after a big move, momentum is fading — that can signal a coming reversal or just a pause. Bitcoin ended April 2026 with an 11.87% monthly gain, reclaiming key support, according to KuCoin-
. That gain followed a run of green weekly candles confirming the recovery. Try drawing a trendline connecting the lows of those green candles. If price breaks below it, the sequence is broken and it's worth trimming your position.
Apply the timeframe rule
A pattern on a 1-minute chart is weak. The same pattern on a 4-hour or daily chart carries far more weight-
. Longer timeframes filter out random noise — a daily candle compresses 24 hours of trading, far more data than a single minute. As of July 2026, Bitcoin's average daily range ran about $2,105, according to LMAX data-
. That's a real move. A 1-minute range might run just $20 — mostly noise. For your first month reading charts, stick to 4-hour or daily candles only. Skip anything under 1 hour until you've logged 50+ hours of screen time.
Tips and Best Practices
- Always verify the reading candlestick charts for crypto trading token contract address on CoinGecko or the official project website before interacting with it — fake tokens with similar names are common.
- Start with a small test transaction when reading candlestick charts for crypto trading for the first time to make sure the process works before committing larger amounts.
- Enable two-factor authentication (2FA) on every exchange and wallet app you use, and store your seed phrase offline in a secure location.
- Check gas fees before confirming any transaction — fees vary significantly by time of day and network congestion.
- Keep a record of every transaction including dates, amounts, and fees for tax reporting purposes.
Ready to start trading?
Trade on Bitget Try CoinTech2uAffiliate links — we may earn a commission at no extra cost to you.
Frequently Asked Questions
What is a candlestick chart in crypto trading?
A candlestick chart shows how a crypto asset moved during a set period, including the opening, closing, high, and low prices. For example, a Bitcoin 1-hour candle with an open of $62,000 and close of $62,500 shows a $500 gain during that hour.
How do I read green and red candles in crypto?
A green candle means the closing price was higher than the opening price, while a red candle means the closing price was lower. If Ethereum moves from $1,700 to $1,750 in a 4-hour candle, that candle shows a $50 upward move.
What do candlestick wicks mean in crypto charts?
A candlestick wick shows the highest and lowest price reached during the candle period. If Solana trades between $75 and $82 but closes at $80, the wick records the price rejection near $82.
Which candlestick patterns should beginners learn first?
Beginners can start with patterns such as engulfing candles and doji candles because they show changes in buying or selling pressure. According to common chart analysis, a doji forms when the open and close prices are close, such as Bitcoin opening at $60,000 and closing at $60,050.
Related Articles
- How to Use a Hardware Wallet for Crypto — Beginner's Guide 2026
- How to Stake LayerZero (ZRO) — Beginner's Guide 2026
- How to Bridge Tokens Between Blockchains — Beginner's Guide 2026
Related Articles
- How to Use a Hardware Wallet for Crypto — Beginner's Guide 2026
- How to Stake LayerZero (ZRO) — Beginner's Guide 2026
- How to Bridge Tokens Between Blockchains — Beginner's Guide 2026