Bitcoin Funding Rate Reversal and Volatility Cycle: 2026 Data Breakdown
BTC funding swung from -0.0015% to +0.01% in 2026 as open interest crashed 50% to USD 44.5B then rebuilt, driving two liquidation cascades.
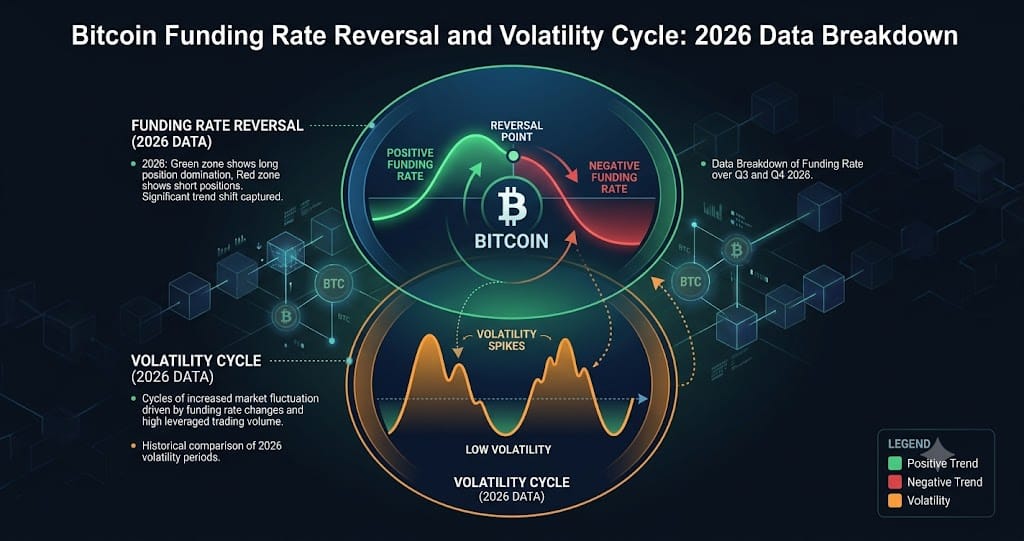
Bitcoin perpetual funding rates completed a full cycle in 2026: a network-wide average of -0.0015% on June 16 deepened into the most negative stretch since the November 2022 FTX collapse, then flipped to a neutral +0.01% by June 27 and a slightly positive +0.0087% by July 7, according to Coinglass and Convex data. Open interest tells the other half of the story, crashing more than 50% from a peak above USD 90 billion to about USD 44.5 billion by June 30, then rebuilding to USD 47.71 billion by July 7 without funding turning aggressively positive.
That reset-and-rebuild pattern, combined with a compression-to-expansion cycle in implied volatility, explains why Bitcoin produced two distinct short squeezes within weeks of each other. A geopolitical shock on July 8 sent BTC to USD 61,481, but unlike the June 17 selloff that triggered rapid short buildup, coin-margined open interest barely moved, falling only from 740,000 BTC to 730,000 BTC, signaling a shift in how leveraged traders responded to bad news.
Funding Rates Diverged Sharply Across Exchanges
The June 16 network average of -0.0015% masked a wide split by venue. Binance sat at a comparatively mild -0.0011%, while OKX printed -0.0059% and Bybit -0.0047%, roughly four to five times deeper than Binance, with Gate.io near flat at -0.0006%, per Coinglass funding rate data cited in a WEEX market update.
This divergence matters for anyone tracking liquidation risk by venue rather than by market average. Short crowding concentrated on OKX and Bybit, platforms with heavier altcoin and retail leverage exposure, which is consistent with why altcoin short liquidations were disproportionately large during the mid-June squeeze. A single blended funding number can hide where the actual risk is sitting.
The Full Negative-to-Neutral-to-Positive Funding Cycle
Glassnode confirmed that aggregate BTC perpetual funding fell to its lowest level since 2023, oscillating between -0.0017% and -0.01% during the longest sustained negative-funding window since the late-2022 bear market bottom, according to coverage on MEXC News. Glassnode identified only three prior episodes of comparably extreme negative funding: the March 2020 COVID crash, the mid-2021 Q2 pullback, and the November 2022 FTX collapse, each followed by a significant rebound within months.
Funding then normalized to +0.01% by June 27, per Convex funding metrics, and edged to +0.0087% by July 7. That means the July 2 to July 6 short squeeze detonated after funding had already returned to neutral territory, not while it was still deeply negative, pointing to stale short positioning rather than fresh funding extremes as the fuel. When the July 8 shock hit and BTC fell to USD 61,481, funding stayed flat to slightly negative and open interest barely declined, a pattern CoinDesk's Daybook attributed to spot and safe-haven selling rather than new leveraged short building.
Open Interest: A 50 Percent Reset Followed By a Cautious Rebuild
Total BTC open interest peaked above USD 90 billion before collapsing to roughly USD 44.5 billion by June 30, a decline of about 50%, then climbed back to USD 47.71 billion by July 7, based on data referenced by crypto.news. In coin-margined terms, OI rose from 687,000 BTC to 740,000 BTC between late June and July 7, then gave back only about 10,000 BTC after the July 8 shock, landing near 730,000 BTC.
On July 7, CoinDesk reported that BTC futures OI actually fell from 776,000 BTC on July 3 to 740,000 BTC even as price rose, with short liquidations dominant for six straight days and the Coinbase premium turning negative, three signals CoinDesk used to conclude the rally was squeeze-driven rather than backed by new long conviction. A simple heuristic circulating among traders holds that when OI rises 20% to 30% within 48 hours while price stays flat, large-scale deleveraging typically follows within 72 hours, according to explainers from Mudrex and Millionero.
Volatility Compression Preceded the Liquidation Cascade
2026 also marked the institutionalization of Bitcoin volatility as a tradable asset. CME listed BVOL volatility futures on June 1, joining Cboe's BITVX contract launched in March, Deribit's DVOL index, and Volmex's BVIV index as four parallel BTC volatility benchmarks, per FinanceFeeds and The Block's BVIV tracker.
Implied volatility compressed to multi-month lows in late May, with DVOL falling to 36.11, a nine-month low, and BVIV dropping to 38%, its lowest reading since October 2025, according to CoinDesk and Bloomberg. That compression preceded the roughly USD 4.56 billion in liquidations recorded over the following 30 days. After the squeeze, realized volatility cooled from 43.74 to 35.71 within a week, CME's BVX index read 40.66 on July 5, down 7.35 points week over week, and BVIV climbed back to 40% by July 7 after peaking near 60% in January.
What to Watch
- Whether funding rates on OKX and Bybit re-diverge from Binance, a signal that short crowding is rebuilding on higher-leverage venues
- Any 48-hour window where BTC open interest rises 20% to 30% without a corresponding price move, historically a precursor to deleveraging within 72 hours
- Coin-margined open interest relative to the 740,000 BTC July 7 high and the 687,000 BTC late-June base, to gauge how much leverage has re-entered
- DVOL, BVIV, and CME BVX readings for renewed compression toward the 36 to 38 range last seen in late May before the June liquidation cascade
Ready to start trading?
Trade on Bitget Try CoinTech2uAffiliate links — we may earn a commission at no extra cost to you.
Related Articles
- Bitcoin ETF Inflows End 8-Week, $8.2 Billion Outflow Streak in July 2026
- Bitcoin's Five Reversals in 25 Days: Inside the July 2026 Liquidation Whipsaw
- Bitcoin Short Squeeze 2026: Inside the $498M Liquidation Event and the $65K-$68K Corridor Ahead
Frequently Asked Questions
Why did Bitcoin funding rates turn negative for so long in mid-2026?
Glassnode data showed aggregate BTC perpetual funding sitting between -0.0017% and -0.01% for the longest stretch since the November 2022 FTX collapse, reflecting persistent short positioning even as spot demand kept pushing price higher, a pattern sometimes called a negative-funding bull market.
What caused the difference in how markets reacted to the June 17 and July 8 shocks?
After the June 17 shock tied to Warsh-related news, short positions built up quickly and funding deepened further negative. After the July 8 geopolitical shock that sent BTC to USD 61,481, coin-margined open interest fell only from 740,000 to 730,000 BTC and funding stayed flat, indicating traders deleveraged rather than added fresh short bets.
What is the 72-hour open interest heuristic used to anticipate liquidation cascades?
It states that when open interest increases 20% to 30% within 48 hours while price remains largely unchanged, a large deleveraging event has historically tended to follow within roughly 72 hours, based on explainers referenced by Mudrex and Millionero.