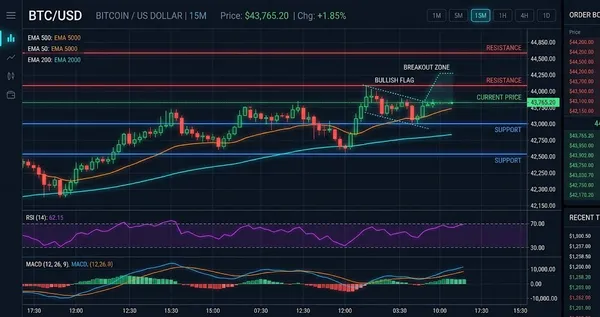
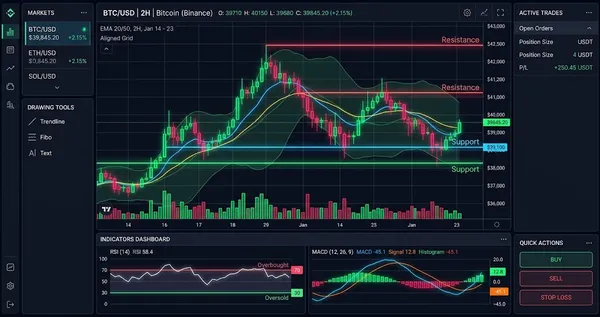
Solana (SOL) Interactive Chart Analysis — July 14, 2026
SOL at $75.22 — interactive chart with EMA, BB, RSI, MACD, S/R levels. MODERATE bearish signal (-40). Funding rate 0.0013%.
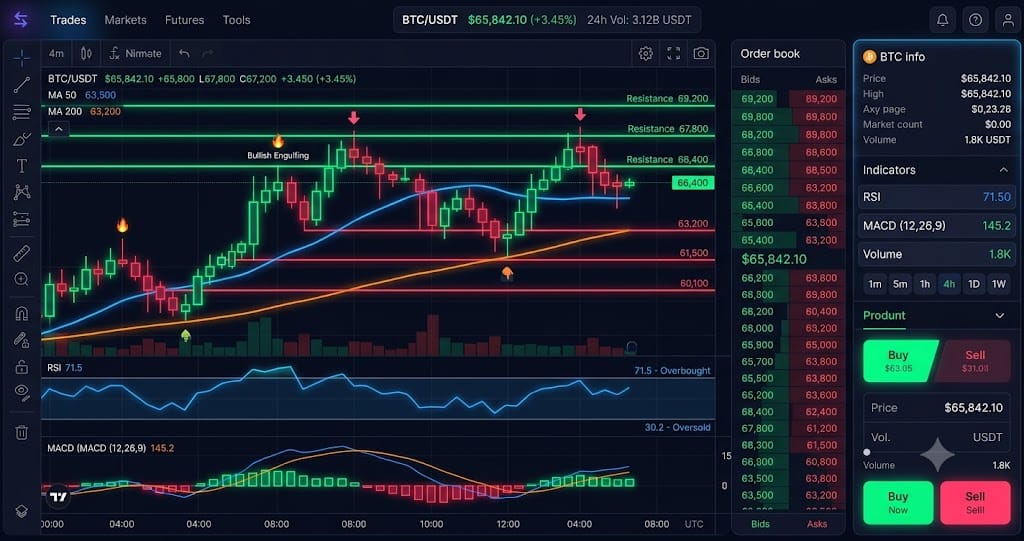
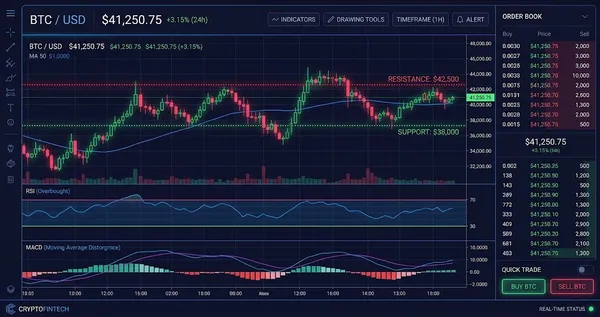
Interactive chart — switch timeframes, toggle indicators, hover for OHLC data
Market Structure
SOL trades at $75.22, below both the EMA20 ($76.23) and EMA50 ($76.71). The -40 signal and negative MACD histogram confirm bearish momentum- . Price holds just above the S1 pivot support at $73.01, with the 0.382 Fibonacci level near $82.50 acting as a distant ceiling- .
Key Levels
| Price | Type | Source | Significance | Distance |
|---|---|---|---|---|
| $84.09 | Resistance | Pivot R3 | Low | +11.8% |
| $81.87 | Resistance | Pivot R2 | Medium | +8.8% |
| $78.55 | Resistance | Pivot R1 | Medium | +4.4% |
| $76.23 | Resistance | EMA20 | Low | +1.3% |
| $75.22 | Current | — | — | — |
| $73.01 | Support | Pivot S1 | Medium | -2.9% |
| $70.79 | Support | Pivot S2 | Medium | -5.9% |
| $68.60 | Support | BB Lower | Low | -8.8% |
| $67.47 | Support | Pivot S3 | Low | -10.3% |
Moving Averages
| MA | Value | Position | Signal |
|---|---|---|---|
| EMA 20 | $76.23 | Below | Bearish |
| EMA 50 | $76.71 | Below | Bearish |
| EMA 200 | $99.91 | Below | Bearish |
| BB Middle (SMA 20) | $76.82 | Below | Bearish |
Volume Analysis
Volume sits at 0.30x the average, indicating extremely light participation. Low volume on a bearish signal suggests sellers lack conviction rather than aggressive distribution- . Per Bitget News, SOL futures open interest stood at $3.5 billion on April 13, with annualized funding at 3%—below the 5-10% neutral band- .
Technical Indicators
Trade Setup
Scenario Analysis
Bullish Case
Trigger: Price breaks above EMA20 at $76.23 with volume expanding above 0.70x average
Target: $82.50 (0.382 Fib resistance)-
Invalidation: Price closes below $73.01 support
A break above the EMA20 would flip the short-term trend and trap bears who have built positions at the 1.53 long/short ratio. The low volume and moderate RSI at 47.4 suggest a squeeze could develop if buyers step in.
Base Case
Trigger: Price holds between $73.01 and $76.23 with volume remaining below 0.50x average
Target: $73.01 - $76.23 range
Invalidation: Daily close above $76.23 or below $73.01
The ATR of $3.44 implies average daily moves of roughly 4.6%, consistent with the current 4.0% range- . With open interest at 9,059,020 contracts and funding at 0.0013% near neutral, the market lacks directional fuel until volume returns.
Bearish Case
Trigger: Price breaks below $73.01 support on volume above 0.50x average
Target: $70.00 (psychological level)-
Invalidation: Price reclaims $76.23
Below S1 support, the next floor sits near $70, where network FUD and macro pressure previously triggered fears- . The negative MACD histogram and price below both EMAs favor continuation, and a breakdown would likely accelerate as stop-losses trigger.
Analysis Summary
Solana (SOL) Resources