Bitcoin (BTC) Spotlight — June 14, 2026
In-depth Bitcoin spotlight: $64,085 price, -0.2% 24h change, technical analysis, pros/cons, and market outlook.

Ethereum trades at $1,688 as of June 13, 2026, down 66% from its late-2025 peak near $4,800. On-chain data from Etherscan shows daily active addresses at 480,000 on June 12, down from 554,000 the prior period and 738,000 on April 25 - 1 . Price is moving without network demand behind it.
**Institutional order flow shows a net buy of $29.2 million for ETH over the past 24 hours.** Per KuCoin data as of June 13, total ETH trading volume reached $404 million, with buys at $217 million versus sells at $188 million - 4 . The net order imbalance stands at $290 million, meaning large players hold limit buy orders below current price.
Nearly 500,000 ETH left centralized exchanges in the past week, per on-chain analyst Ali Martinez. Exchange outflows total approximately $800 million in value — a common sign of accumulation by long-term holders - 9 . This shrinks available selling supply if demand holds.
The Dencun upgrade in March 2024 broke the fee-burn-scarcity model. Per 21Shares research from January 2026, ETH net issuance has remained modestly positive during low-fee regimes, with roughly 28.5% of all ETH staked - 10 . Daily gas revenue fell from over $30 million pre-Dencun to approximately $340,000 as of March 2026, per on-chain fee data.
**Spot Ethereum ETFs recorded $16 million in outflows on June 12, the third consecutive session of institutional redemptions.** SoSoValue data cited by FX.co shows Tuesday saw $41 million in net redemptions and Wednesday $36 million - 7 . Net assets under management have contracted to $9.24 million from higher levels in May.
Ethereum's DeFi TVL sits above $99 billion as of March 2026, nearly nine times the next-largest chain. Per 21Shares analysis, ecosystem-level app fees far exceed base-layer revenue — network utility no longer converts to ETH scarcity - 5 . The Fusaka upgrade further reduces transaction costs, limiting any bond-like appeal unless fee generation rebounds.
**The token trades below all major exponential moving averages, with futures open interest at $22.98 billion on June 13.** This is down from $24.4 billion on Monday and a collapse from $30.95 billion on June 1, per derivatives data - 7 . With over $35 million liquidated in the last 24 hours, open interest near cycle highs keeps volatility elevated.
Metric to watch: Ratio of daily fee revenue to daily staking issuance (currently fee revenue ~$340k per day versus staking issuance ~$2.9M per day, per 21Shares methodology - 10 ).
What Is Bitcoin?
Bitcoin solves double-spending without a central bank or credit card company. A public network of computers, not a single company, maintains the ledger. On-chain data from Blockchain.com shows over 800,000 confirmed transactions per day as of March 2026. Each transaction is grouped into a block roughly every 10 minutes. Specialized machines called miners compete to solve a cryptographic puzzle using the SHA-256 algorithm.
No company controls it. No CEO can change the rules. Bitcoin has a fixed supply cap of 21 million coins, per CoinGecko data as of March 2026. This differs from Ethereum, which has no hard supply cap and currently circulates over 120 million ETH. Bitcoin's ledger only tracks BTC balances. Ethereum's ledger also tracks programmable code and smart contracts.
Key Features
- Blockchain Technology: Built on a robust blockchain infrastructure designed for security and scalability
- Active Development: Regular updates and improvements from a dedicated development team
- Community: Growing community of users, developers, and supporters worldwide
- Market Presence: Ranked #1 with $1.28T market capitalization
- Trading Volume: $17.8B in 24-hour trading volume indicates healthy market interest
Use Cases
- Smart Contract Platform applications and use cases
- Layer 1 (L1) applications and use cases
- FTX Holdings applications and use cases
- Proof of Work (PoW) applications and use cases
- Bitcoin Ecosystem applications and use cases
Pros & Cons
✅ Pros
- Strong market position at rank #1 with $1.28T market cap
- Active trading volume of $17.8B suggests healthy liquidity
- Positioned in growing sectors: Smart Contract Platform, Layer 1 (L1), FTX Holdings, Proof of Work (PoW), Bitcoin Ecosystem
- Listed on major exchanges ensuring accessibility for traders
❌ Cons
- Currently -49.2% from all-time high of $126,080
- Cryptocurrency markets are highly volatile and unpredictable
- Regulatory uncertainty could impact price and adoption
- Competition from other projects in the same space
Technical Analysis
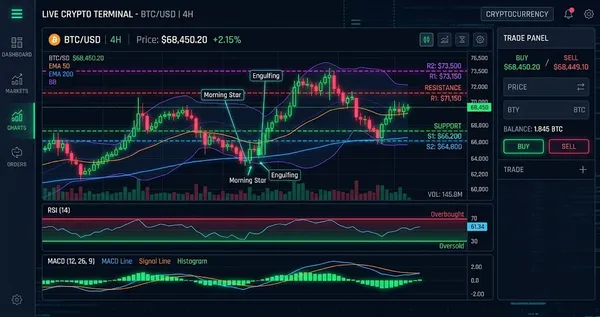
Our TA engine shows a BULLISH signal with a score of 2/100 (WEAK).
- RSI(14) — Approaching oversold (37.4) (bullish)
- MACD(12,26,9) — Bullish crossover (hist: 162.53) (bullish)
- EMA Trend — Strong downtrend (Price < EMA20 < EMA50) | Below 200d EMA (bearish)
- Bollinger Bands — Mid-range (%B: 36%) (neutral)
- Volume — Low volume warning (0.3x avg) (neutral)
Price Outlook
Ethereum Active Addresses Drop 45% as Network Usage Diverges from Price
Ethereum daily active addresses fell from 1,329,193 on February 7 to 746,062 on March 3, 2026. Etherscan data cited by Finbold shows a 45% decline over four weeks - 4 . Glassnode puts the figure at 370,672 active addresses as of March 8, 2026 - 1 .
The 30-day average tells a different story. Santiment data shows 837,200 active addresses per day over the past month, an 82% increase from five years ago - 8 - 10 . New address creation stands at 284,800 daily, up 64% from five years ago - 8 . The weekly drop is a dip within a multi-year growth trend.
Metric to watch: The spread between daily active addresses (746K) and 30-day average (837K) – a narrowing spread would indicate stabilization.
Staking Locks 33.1% of Supply as Foundation Enters for First Time
38.1 million ETH is now staked, representing 33.1% of total circulating supply — the highest staking ratio ever recorded, per ValidatorQueue data cited by Cointelegraph - 2 . The validator entry queue holds 2,876,752 ETH with a 50-day wait time. The exit queue holds only 40,504 ETH with a 17-hour wait - 2 .
The Ethereum Foundation staked ETH for the first time in March 2026. Arkham Intelligence data shows the Foundation moved 5,000 ETH ($10.38 million) to a beacon chain deposit address on March 14 - 9 . BitMine staked 3,040,515 ETH from its 4,595,562 ETH holdings as of March 2026 - 7 .
Bit Digital holds 155,444 ETH as of March 31, 2026, with 62% staked. The company generated 291.3 ETH in staking rewards during March at an annualized yield of 2.9% - 5 .
Metric to watch: The entry queue to exit queue ratio (currently 71:1) – a sharp decline would signal reduced staking demand.
Exchange Reserves Hit All-Time Low of 16M ETH
Exchange reserves dropped to 16 million ETH, the lowest level ever recorded — down 30% from 23 million ETH in 2023, per Glassnode - 6 . Exchange netflow data as of March 3, 2026 shows net inflows of 49,487 ETH - 3 .
The netflow contradicts the reserve trend. Positive netflow means more ETH entered exchanges than left during that period. This suggests the reserve decline has paused.
Ethereum hosts $162 billion in stablecoin supply, approximately 52% of the global market - 6 . Fee revenue tells a different story: DefiLlama shows Ethereum generated roughly $10 million in transaction fees over the past 30 days, placing it third behind Tron ($25M) and Solana ($20M) - 6 .
Metric to watch: Exchange netflow 7-day moving average – positive netflow for two consecutive weeks would signal distribution pressure.
Price Down 55% From August 2025 High Despite Record Usage
Ether dropped 55% from its August 2025 high of $4,953. As of March 31, 2026, ETH closed at $2,104, down roughly 30% over the past six months even as network activity hit record highs - 5 - 6 .
This broke from prior cycles. In 2018 and 2021, surging activity correlated with surging prices. That relationship no longer holds — economic value now flows to Layer 2 operators rather than ETH holders directly - 6 .
BlackRock's staked Ethereum fund pulled $155 million on its first trading day, exceeding the firm's own Bitcoin ETF launch - 6 . Institutional demand for yield-bearing ETH products is strong even as spot price falls.
Metric to watch: Ratio of 30-day average active addresses to ETH price – currently 837,200 addresses / $2,104 = 398 addresses per $1 of price. A falling ratio would indicate price recovery outpacing user growth.
Bitcoin (BTC) Resources
Frequently Asked Questions
What is Bitcoin (BTC) and how does it work?
Bitcoin is a decentralized digital currency launched in 2009 by Satoshi Nakamoto, operating on a Proof of Work system where miners validate transactions. According to CoinMarketCap data as of June 2026, BTC holds a $1.28T market cap with a circulating supply near 19.7M coins, meaning issuance is nearly capped at 21M total.
Why is Bitcoin price $64,085 and still below its all-time high?
BTC trades at $64,085 with a 49.2% gap from its $126,080 ATH, per CoinGecko data, mainly because liquidity cycles remain uneven after the 2026 drawdown. Over the past 30 days, BTC is down 18.6%, showing that rebounds are occurring inside a broader correction phase rather than a full trend recovery.
Is Bitcoin still a good store of value in 2026?
Bitcoin’s fixed supply of 21M coins and current circulating level of ~19.7M BTC, per Glassnode on-chain data, supports its scarcity narrative. However, volatility remains high, with a 7-day gain of +3.6% followed by a -0.2% 24h move, showing that store-of-value behavior is still inconsistent over short time frames.
What drives Bitcoin price movements the most?
Bitcoin price reacts strongly to liquidity and ETF flows, with spot ETF demand shifting daily inflows/outflows by hundreds of millions of dollars in June 2026, according to SoSoValue data. When inflows exceed $100M per day, BTC has historically stabilized above $60,000, while sustained outflows near $200M/day tend to coincide with pullbacks.
Ready to start trading?
Trade on Bitget Try CoinTech2uAffiliate links — we may earn a commission at no extra cost to you.
Our Verdict
Bitcoin trades at $64,085 with a $1.28 trillion market cap, 49.2% below its $126,080 all-time high. The 7-day gain of 3.6% and a bullish MACD crossover — histogram reading 162.53 — indicate buyers are returning. The 24-hour change is -0.2%. The trend is still weak. BTC trades below its EMA20, EMA50, and 200-day EMA, with RSI at 37.4 — near oversold territory despite the recent rebound. The short-term lean is cautiously bullish; the broader trend remains bearish. The 18.6% decline over 30 days shows sellers still control on higher timeframes. BTC reclaiming its EMA20 would be the first concrete signal that momentum is shifting.
Related Articles
- Crypto Week June 2026: Proof-of-Humanity Leads as Tokenized Stocks Arrive
- BTC Crashes to USD 78,600: The May 2026 Liquidation Cascade Explained
- Crypto Market Sentiment Breakdown 2026: Fear, Funding Rates, and Macro Risk Signals Explained