BTC Crashes to USD 78,600: The May 2026 Liquidation Cascade Explained
On May 15-16 2026, USD 581M in crypto liquidations hit — 95% long positions. BTC fell to $78,600 as surging bond yields and macro risk-off drove the
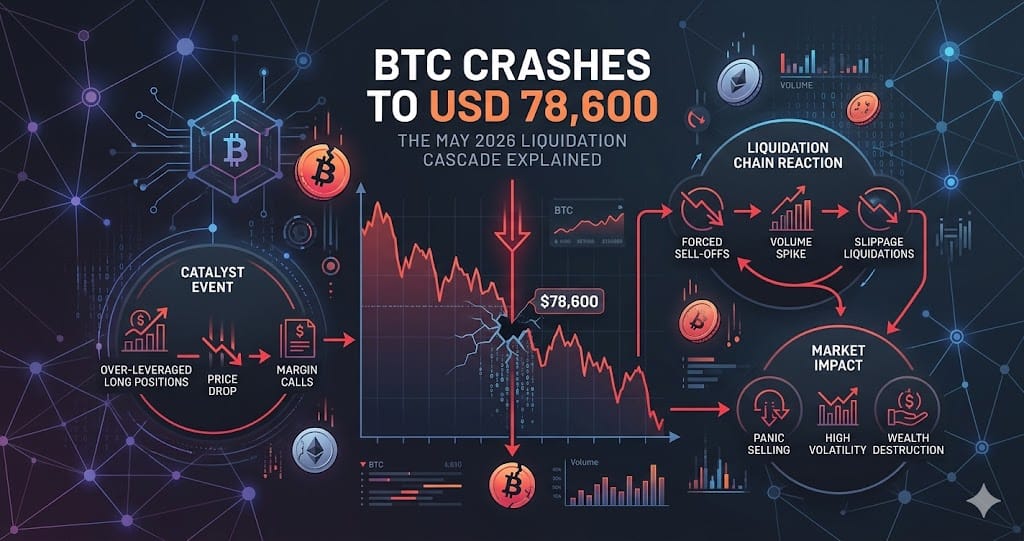
Between May 15 and 16, 2026, the crypto market suffered its largest long-liquidation event since March, with USD 581 million in total positions wiped out in 48 hours — USD 552 million of that from long positions, representing a long-to-short liquidation ratio of 19.7 to 1. BTC fell to USD 78,600, ETH dropped 3.3 percent in a single day, and SOL and DOGE each shed 5 percent.
This was not a crypto-native deleveraging. The immediate triggers were a US 10-year Treasury yield hitting 4.58 percent — a December high — and the UK 10-year gilt reaching 5.2 percent, its highest level since 2008. Global macro risk-off transmitted directly into crypto markets, marking a clean break from the internal leverage-flush dynamics that had defined the preceding weeks.
Four Phases: How the Market Got Here
The May 15-16 cascade is best understood as the fourth phase of a structured deleveraging cycle that began April 14. Phases one through three — spanning roughly April 14 to May 12 — were characterized by a short squeeze cycle driven by crypto-internal leverage dynamics, culminating in a top breakdown on May 13 when USD 127 million in longs were liquidated in the first reversal signal. May 14 then registered just USD 64.89 million in total liquidations, the lowest daily figure of the month, appearing briefly as a completed deleverage state.
Phase four broke that pattern entirely. Within 36 hours of that apparent stabilization, a confluence of four macro events — rising US and UK bond yields, the US House vote on the CLARITY Act on May 14 introducing regulatory uncertainty, and lingering inflation anxiety following the May 12 CPI reading — converged to restart the cascade. The USD 360 million in longs liquidated on May 15 alone accelerated to USD 552 million by May 16, a 53 percent jump in 24 hours that is characteristic of self-reinforcing cascade mechanics.
Bond Yields, Stocks, and Crypto's New Macro Correlation
The US 10-year Treasury yield touching 4.58 percent and the UK gilt reaching 5.2 percent on May 15 triggered simultaneous selling across asset classes. Nasdaq 100 opened down 1.7 percent, S&P 500 fell 1.2 percent, and gold dropped 2.5 percent to USD 4,500. Crypto was not a safe haven — it moved in lockstep with the global risk-off rotation.
This is a structural distinction from the April-to-early-May period. Those earlier liquidations were driven by crowded long positioning within crypto perpetual futures markets, independent of equities macro. The May 15-16 event represents the first phase of this cycle where the liquidation trigger was entirely external — sovereign bond markets — and crypto correlation with traditional risk assets was near-complete. The pre-flagged risk of USD 6.8 billion in longs facing liquidation at the USD 80,000 BTC level, documented by The Market Periodical on May 1, materialized precisely as that level broke.
Open Interest Collapse and Funding Rate Divergence
BTC futures open interest has followed a two-stage collapse. From the May 10 all-time high of approximately USD 112 billion, OI fell to USD 59.58 billion by May 13 — a 47 percent drop in three days. New data from Ainvest indicates OI continued declining to approximately USD 49 billion by mid-week, meaning the total May drawdown is roughly USD 63 billion or 56 percent — among the fastest deleverage sequences in BTC perpetuals history.
Funding rates across exchanges are not moving uniformly. Binance BTC/USDT funding sits at -0.0002 percent — nearly neutral — while OKX BTC/USDT registers -0.0028 percent, a 14-times larger negative reading. The market-weighted average is approximately -0.002 percent. This divergence reflects structural client differences: Binance's higher institutional mix tends to deleverage earlier, while OKX's retail-heavy Asian user base maintains crowded short positioning longer. Research from Phemex notes this marks roughly 46 consecutive days of negative funding rates — a historical anomaly that has preceded major short squeezes on two prior occasions, most notably following the FTX collapse in late 2022.
Altcoin Leverage Concentration and the Hyperliquid Mechanism
The cross-asset drawdown on May 15 revealed a clear leverage hierarchy: ETH fell 3.3 percent on the day and 5.3 percent for the week, making it the worst performer among major assets. SOL dropped 5 percent, XRP fell 4.3 percent, and DOGE shed 5 percent. BTC led absolute liquidation volume at USD 189 million, followed by ETH at USD 151 million — but ETH and SOL showed higher sustained multi-day drawdowns, consistent with their greater long-side bias in perpetual futures positioning observed since May 13.
Hyperliquid's funding rate mechanism amplifies this for traders on that platform specifically. Where Binance settles funding every 8 hours — three times per day — Hyperliquid settles every hour, or 24 times daily, with a funding cap of 4 percent per hour. This structural difference means that counter-trend positions on Hyperliquid accumulate holding costs at roughly eight times the rate of equivalent positions on Binance, which explains the outsized losses documented among top traders on that platform during the May volatility window.
What to Watch
- BTC open interest trajectory: a further compression from the current USD 49 billion toward USD 40-45 billion would represent a second structural reset and historically precedes bottoming processes that are gradual rather than V-shaped.
- The 46-day negative funding rate window: while not a timing tool — historical gaps between crowded positioning and price reversal can span weeks to months — sustained OKX funding at -0.0028 percent signals persistent short crowding that could accelerate a squeeze when macro conditions stabilize.
- US and UK sovereign bond yields: if the 10-year Treasury holds above 4.5 percent or the UK gilt remains near 5.2 percent, continued institutional risk-off rotation into treasuries will sustain pressure on crypto correlations.
- CLARITY Act implementation progress: the May 14 House vote introduced regulatory uncertainty as the fourth macro axis alongside bond yields, inflation expectations, and geopolitical risk. Any clarifying guidance on the bill's scope could reduce one of the four active headwinds.
Ready to start trading?
Trade on Bitget Try CoinTech2uAffiliate links — we may earn a commission at no extra cost to you.
Related Articles
- Crypto Market Week in Review: TON, Clarity Act, and Altseason 2026
- Bitcoin Liquidation Cascade May 2026: What the Data Reveals
- Crypto Narratives in May 2026: RWA, BTCFi, and Selective Altcoin Rotation
Frequently Asked Questions
What caused the crypto liquidation cascade on May 15-16, 2026?
The primary triggers were external macro factors: the US 10-year Treasury yield hitting 4.58 percent and the UK 10-year gilt reaching 5.2 percent — its highest level since 2008 — on May 15. These drove a global risk-off selloff that hit equities and crypto simultaneously. A secondary trigger was legislative uncertainty around the CLARITY Act vote in the US House on May 14. The combination broke BTC below the USD 80,000 support level that had held USD 6.8 billion in long positions, triggering a self-reinforcing cascade that totaled USD 581 million in liquidations over 48 hours.
Why is the BTC futures open interest decline significant?
BTC futures open interest fell from an all-time high of approximately USD 112 billion on May 10 to roughly USD 49 billion by mid-May — a drawdown of USD 63 billion or about 56 percent in under two weeks. This scale of deleverage is among the fastest in BTC perpetuals history. A lower OI base reduces the fuel available for both cascading liquidations and potential short squeezes, but it also signals structural positioning reset. If OI compresses further toward USD 40-45 billion, historical patterns suggest a slow bottoming process rather than a rapid V-shaped recovery.
What does the funding rate divergence between Binance and OKX indicate?
Binance BTC/USDT funding is at -0.0002 percent, essentially neutral, while OKX sits at -0.0028 percent — 14 times more negative. This means short-side crowding is substantially higher on OKX than on Binance. Historically, Binance's institutional client base tends to deleverage earlier in a cycle, leaving retail-dominated platforms like OKX with residual crowded positioning. If a short squeeze develops, OKX's accumulated short pressure means it is likely to be the marginal driver of any upside price acceleration, while Binance acts as a more balanced price discovery venue.


