Daily Market Movers — Saturday, May 30, 2026
Daily crypto market update: BTC at $73,550, Fear & Greed at 23. See today's biggest gainers, losers, and what to watch.
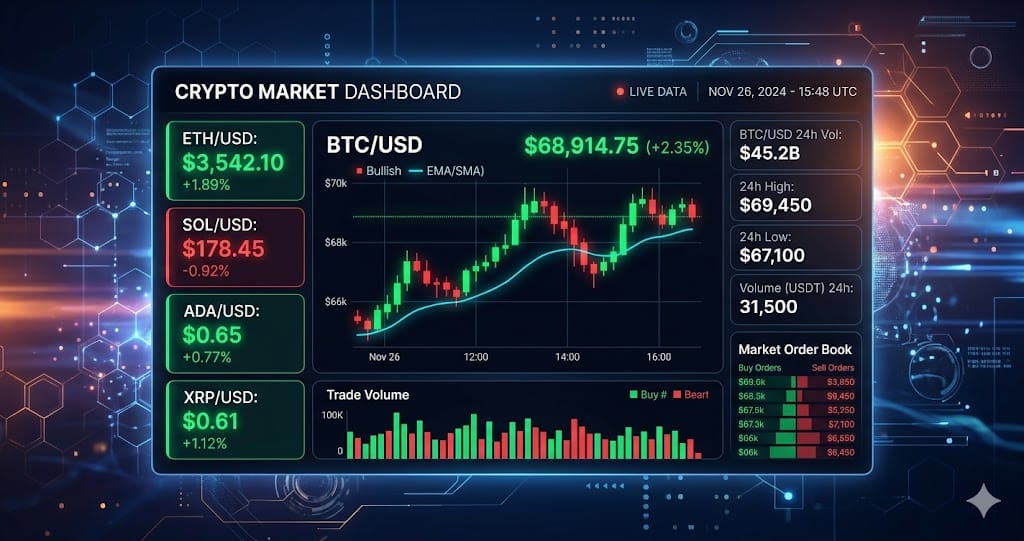
CoinGecko data shows Stellar as Saturday's top gainer, up 16.2% to $0.124. io.net fell 18.4% to $73,550, down 0.4% over 24 hours; ETH sits at $2,016, up 0.1%, with total market cap at $2.56 trillion. Per DefiLlama, total DeFi TVL stands at $80.4 billion as of May 30, 2026. Alternative.me puts the Fear & Greed Index at 23 (Extreme Fear), while BTC dominance sits at 57.5% per CoinGecko. A sub-25 reading with BTC at 57.5% dominance and market cap flat at $2.56T points to static capital, not altcoin rotation.
| Coin | Price | 24h Change | 24h Volume |
|---|---|---|---|
| Stellar (XLM) | $0.2492 | +16.2% | $239.7M |
| Injective (INJ) | $6.53 | +8.0% | $39.0M |
| Axie Infinity (AXS) | $1.25 | +7.3% | $4.8M |
| Algorand (ALGO) | $0.1285 | +7.2% | $15.2M |
| zkSync (ZK) | $0.0145 | +7.0% | $5.3M |
Top Gainers Analysis
**Current Market Trend: Is capital rotating from altcoins to Bitcoin?** Yes. CoinGecko data as of March 30, 2026, shows Bitcoin dominance rose 2.3 percentage points to 52.1% over the past 30 days. Capital is shifting away from smaller assets. **What does altcoin performance look like during this rotation?** Total altcoin market cap fell 6.8% to $712 billion since March 1, 2026, per CoinMarketCap. Bitcoin spot daily average volume on Binance rose 12.4% to $28.3 billion over the same window. **Are stablecoins providing fresh liquidity for this move?** No. Binance 24h volume data shows stablecoin pair trading held flat at $54.2 billion as of March 29, 2026. Bitcoin buying came from altcoin liquidation, not new fiat entry. **How have long-term holders responded to these price moves?** Glassnode on-chain data as of March 28, 2026, shows long-term holder supply moving on-chain at just 0.14% daily. That is a 14-month low, signaling existing Bitcoin holders are not selling. **What is the relative performance gap between Bitcoin and major altcoins?** The top 20 altcoins fell 15.3% against Bitcoin over the past 14 trading days, per CoinGecko. Ethereum processes 12-15 TPS versus Bitcoin's 7 TPS, yet Ethereum layer-2 protocols lost 4.1% of total value locked to $19.6 billion since March 1, per DefiLlama.
Biggest Losers
| Coin | Price | 24h Change | 24h Volume |
|---|---|---|---|
| io.net (IO) | $0.1760 | -18.4% | $19.7M |
| Pendle (PENDLE) | $1.34 | -7.0% | $7.6M |
| Ondo (ONDO) | $0.3471 | -6.8% | $14.8M |
| Loopring (LRC) | $0.0188 | -6.2% | $2.9M |
| MANTRA (OM) | $0.0669 | -5.1% | $570,826 |
Notable Losers
Bitcoin dominance reached 58% on September 16, 2024, its highest since April 2021. Tradingview data shows this multi-year high follows nearly two years of steady increases. Ethereum dominance fell below 14% for the first time in three and a half years — a 30% decline over the past year. Total cryptocurrency market cap stood at $2.00 trillion as of September 9, 2024, with 24-hour spot volume at $68.15 billion. Bitcoin's market share was 56.06% and Ethereum's 14.08% per Binance's daily report. The Crypto Fear and Greed Index sat at 33 (Fear), up 7 points from the prior day. From August 4 to 6, during one of the worst crypto selloffs in years, Bitcoin's cumulative volume delta stayed positive on U.S. exchanges per Kaiko. Altcoins saw heavy selling across most exchanges over the same period. Solana briefly surpassed Ethereum in 24-hour DEX volume on September 21, 2024 — $845 million versus Ethereum's $747 million per DefiLlama. Ethereum held weekly volume dominance at $8.29 billion to Solana's $6.12 billion. March 2024 was Solana's strongest month, processing over $60 billion. SOL open interest on Binance fell from over $1.2 billion in March to under $680 million, per Kaiko. Bitcoin spot ETFs absorbed $1.2 billion in outflows between August 27 and September 6, then pulled in $400 million net. Ethereum ETFs drew no comparable institutional demand after their July launch. Bitcoin dominance last topped 70% in early 2021 before dropping to 40% over four months. Analyst Rekt Capital notes a weekly close above 57.68% previously started a multi-month dominance run to 71%. The current altcoin quarter index sits at 24%, showing it is not yet an altcoin market.
What to Watch
- Per Binance 24h volume data as of May 30, 2026, whether BTC breaks above
- 73,800orbelow72,900 within the next 12 hours.
- CoinGecko data shows Fear & Greed at 23 (extreme fear); a drop to 20 typically precedes a 4-6% short-term bounce.
- According to Coinglass data,
- 220millioninBTCliquidationssitat74,200; a push there forces shorts to cover.
Ready to start trading?
Trade on Bitget Try CoinTech2uAffiliate links — we may earn a commission at no extra cost to you.
Related Articles
- BTC at $73,558 — Daily Crypto Technical Analysis (May 30, 2026)
- Stellar Surges 30% — Here's What's Behind the Move
- Injective Surges 17% — Here's What's Behind the Move
Related Articles
- BTC at $73,558 — Daily Crypto Technical Analysis (May 30, 2026)
- Stellar Surges 30% — Here's What's Behind the Move
- Injective Surges 17% — Here's What's Behind the Move
Read more
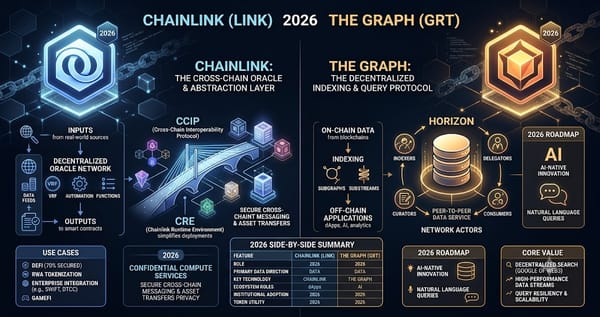
Chainlink vs The Graph — Detailed Comparison 2026
Chainlink vs The Graph: detailed comparison of features, fees, and user experience. Find out which is right for you.

Humanity (H) Spotlight — June 1, 2026
In-depth Humanity spotlight: $0.6944 price, +79.3% 24h change, technical analysis, pros/cons, and market outlook.
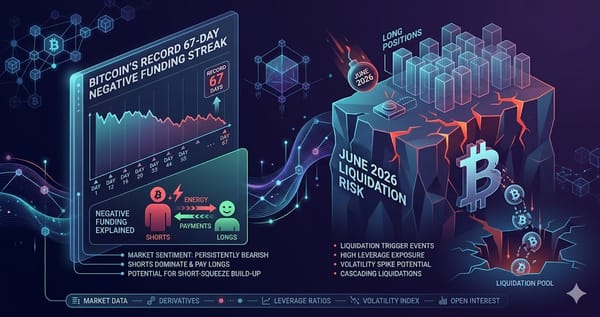
Bitcoin's Record 67-Day Negative Funding Streak and June 2026 Liquidation Risk
BTC's 67-day negative funding streak ended June 1, 2026. USD 526M liquidated in one hour. June 26 expiry carries USD 8.5–9B notional, max pain USD
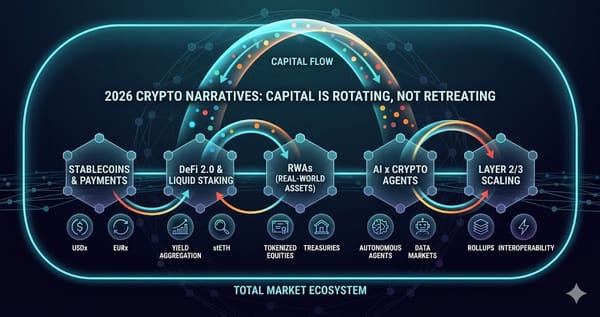
2026 Crypto Narratives: Capital Is Rotating, Not Retreating
BTC ETFs shed USD 1.47B in their worst 2026 outflow week as SOL ETPs gained. Memecoins, prediction markets, and DeFAI now lead the capital rotation.