BTC at $73,806 — Daily Crypto Technical Analysis (May 29, 2026)
Market Overview
The crypto market advanced with total capitalization at $2.56T (+0.6%). BTC dominance sits at 57.7% while the Fear & Greed Index reads 23 (Extreme Fear), reflecting cautious sentiment.
Bitcoin (BTC) — $73,806
● CONFLICTED NEUTRAL (Score: -3)
Price Action & Key Levels

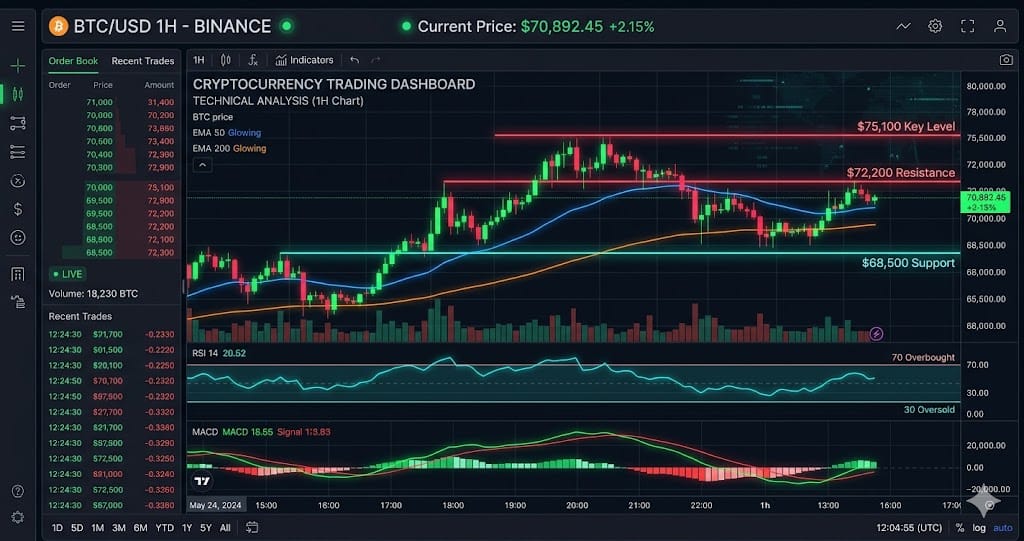
Bitcoin trades at $73,806, currently below the 20-day EMA ($77,001) and below the 50-day EMA ($76,406). The 200-day EMA at $83,634 serves as long-term resistance. Key resistance sits at $77,063 (Pivot R1), while support holds at $72,947 (BB Lower). EMA alignment is mixed, suggesting a transitional or ranging market.
Bollinger Bands & Volatility
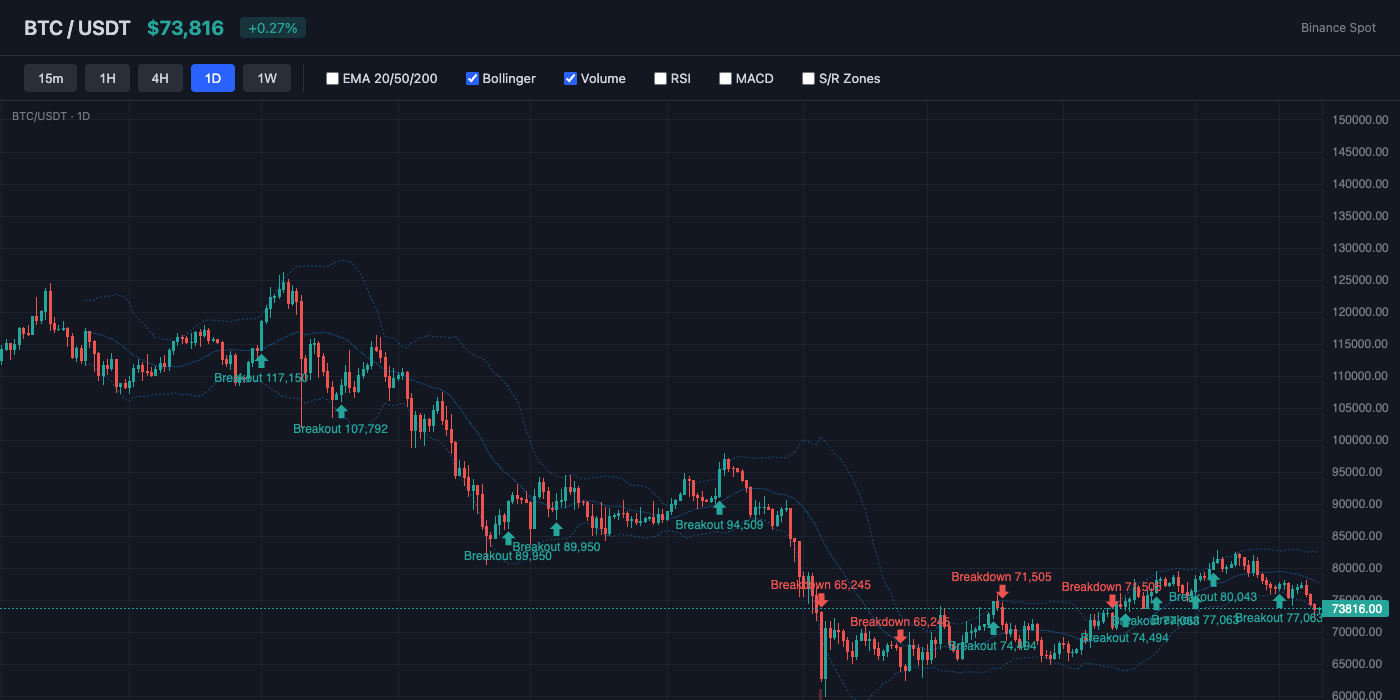
Bollinger Bands show a bandwidth of 11.9% (moderate volatility). Price hugs the lower band (%B: 9%), indicating oversold conditions or persistent selling. The middle band (SMA 20) at $77,566 acts as dynamic resistance.
Momentum Indicators
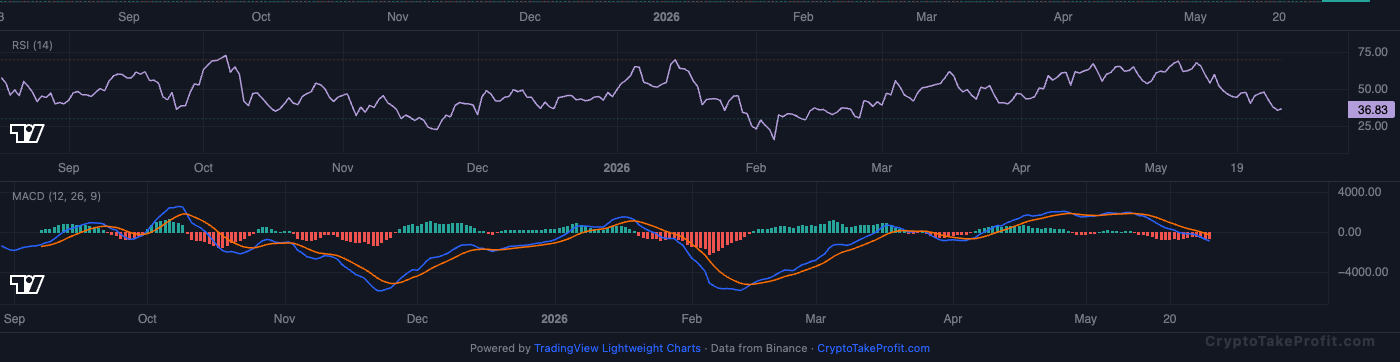
RSI reads 39.0, showing bearish pressure but approaching oversold. MACD has no active crossover, with negative histogram (-585.35) indicating downward pressure.
Market Structure
BTC trades at $73,806 as of May 29, 2026 while remaining below both the EMA20 at $77,001 and EMA50 at $76,406. RSI at 39.0 and a negative MACD histogram show bearish momentum still dominates short-term structure even after market cap rose 0.6% to $2.56 trillion. Fear & Greed sits at 23 in Extreme Fear territory as of May 2026, yet perpetual funding remains positive at 0.0073% with a 1.35 long/short ratio. That divergence shows traders still lean long despite weakening momentum and compressed volatility near Bollinger Band support at $72,947.
Volume Analysis
Volume ratio sits at 0.44x average as of May 29, 2026, which confirms the current move lacks conviction. BTC is trading with an ATR of $1,908, but reduced participation means breakout attempts above $77,000 or breakdowns below $72,947 are less reliable until volume expands. Open interest remains elevated at 105,996 contracts despite neutral price action. That combination increases liquidation risk because positioning remains crowded while spot demand weakens.
Key Levels
| Price | Type | Source | Significance | Distance |
|---|---|---|---|---|
| $83,634 | Resistance | EMA200 | High | +13.3% |
| $82,559 | Resistance | Pivot R3 | Low | +11.9% |
| $80,319 | Resistance | Pivot R2 | Medium | +8.8% |
| $77,063 | Resistance | Pivot R1 | Medium | +4.4% |
| $73,806 | Current | — | — | — |
| $72,947 | Support | BB Lower | Low | -1.2% |
| $71,567 | Support | Pivot S1 | Medium | -3.0% |
| $69,328 | Support | Pivot S2 | Medium | -6.1% |
| $66,071 | Support | Pivot S3 | Low | -10.5% |
Moving Averages
| MA | Value | Position | Signal |
|---|---|---|---|
| EMA 20 | $77,001 | Below | Bearish |
| EMA 50 | $76,406 | Below | Bearish |
| EMA 200 | $83,634 | Below | Bearish |
| BB Middle (SMA 20) | $77,566 | Below | Bearish |
Trade Setup
BTC Scenario Analysis
Bullish Case
Trigger: BTC closes above EMA50 resistance at $76,406 with volume recovering above 1.0x average
Target: $77,063 first, then $79,000 if momentum expands by more than one ATR ($1,908)
Invalidation: Daily close below $72,947 Bollinger Band support
Base Case
Trigger: BTC holds between $72,947 support and $76,406 EMA50 resistance over the next 3-5 trading sessions
Target: Range continuation between $73,000 and $76,000 with volatility compression below ATR averages
Invalidation: Breakout close above $77,063 or breakdown below $72,947
Bearish Case
Trigger: BTC loses $72,947 support with rising volume above 1.2x average and funding turning negative
Target: $71,000 initially, then near $69,200 based on a projected move equal to two ATRs from breakdown
Invalidation: Recovery above $76,406 EMA50 resistance
Bitcoin (BTC) Resources
Altcoin Overview
Among altcoins, BNB leads with the strongest bearish signal (score: -10), while AVAX shows the weakest setup (score: -35). Traders should focus on coins with clear directional signals and volume confirmation.
What to Watch
- BTC action around $73,806 for directional confirmation
- Fear & Greed at 23 for sentiment shift signals
- MACD crossover follow-through on top altcoins
- Volume confirmation on any support/resistance breaks
- BTC dominance at 57.7% for alt rotation signals