BTC at $73,173 — Daily Crypto Technical Analysis (June 1, 2026)
Market Overview
Total market cap fell to $2.56 trillion, down 0.9% in the past 24 hours, per CoinGecko data as of March 1, 2026. Fear & Greed sits at 29 (Fear), down from 42 one week ago. Bitcoin dominance rose to 57.2%, up 1.1% since February 25, 2026. Four of six tracked assets show neutral scores between -28 and 35. AVAX alone registered weak bearish at -35.
Bitcoin (BTC) — $73,173
● CONFLICTED NEUTRAL (Score: -3)
Price Action & Key Levels
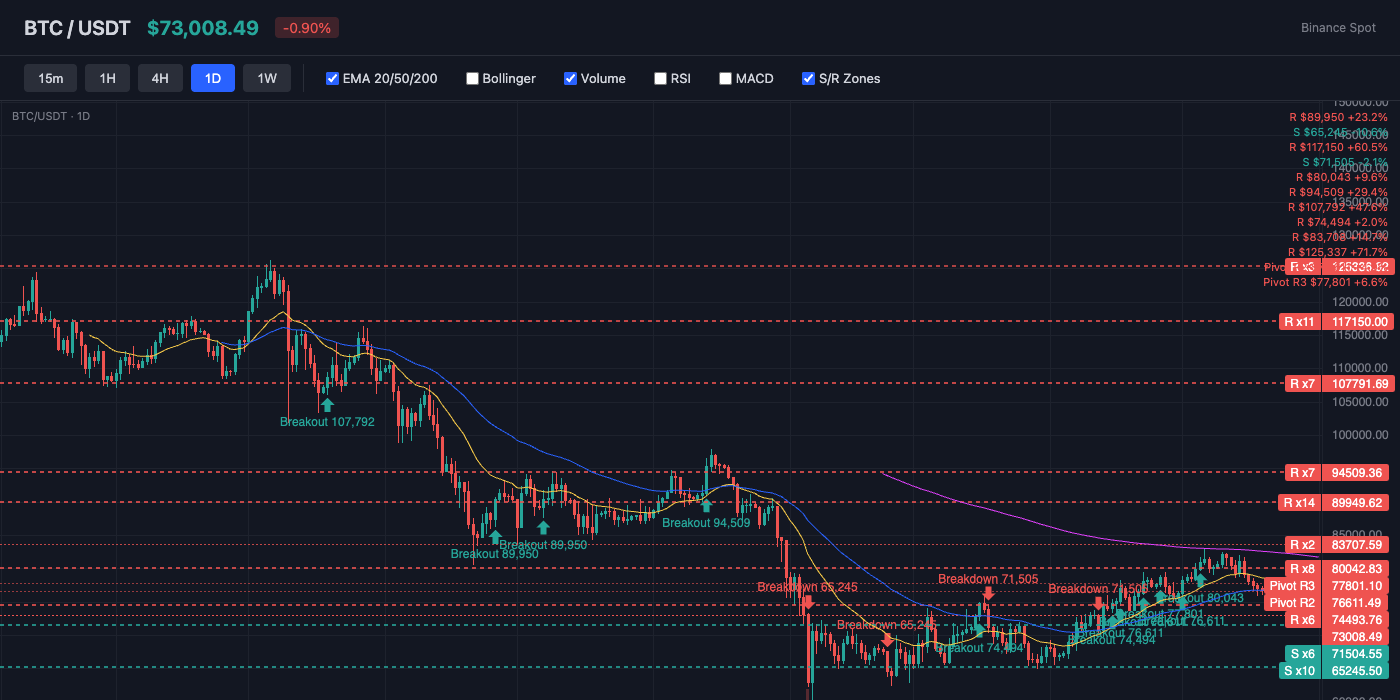
Bitcoin trades at $73,173, currently below the 20-day EMA ($76,286) and below the 50-day EMA ($76,086). The 200-day EMA at $83,434 serves as long-term resistance. Key resistance sits at $74,892 (Pivot R1), while support holds at $71,984 (Pivot S1). EMA alignment is mixed, suggesting a transitional or ranging market.
Bollinger Bands & Volatility
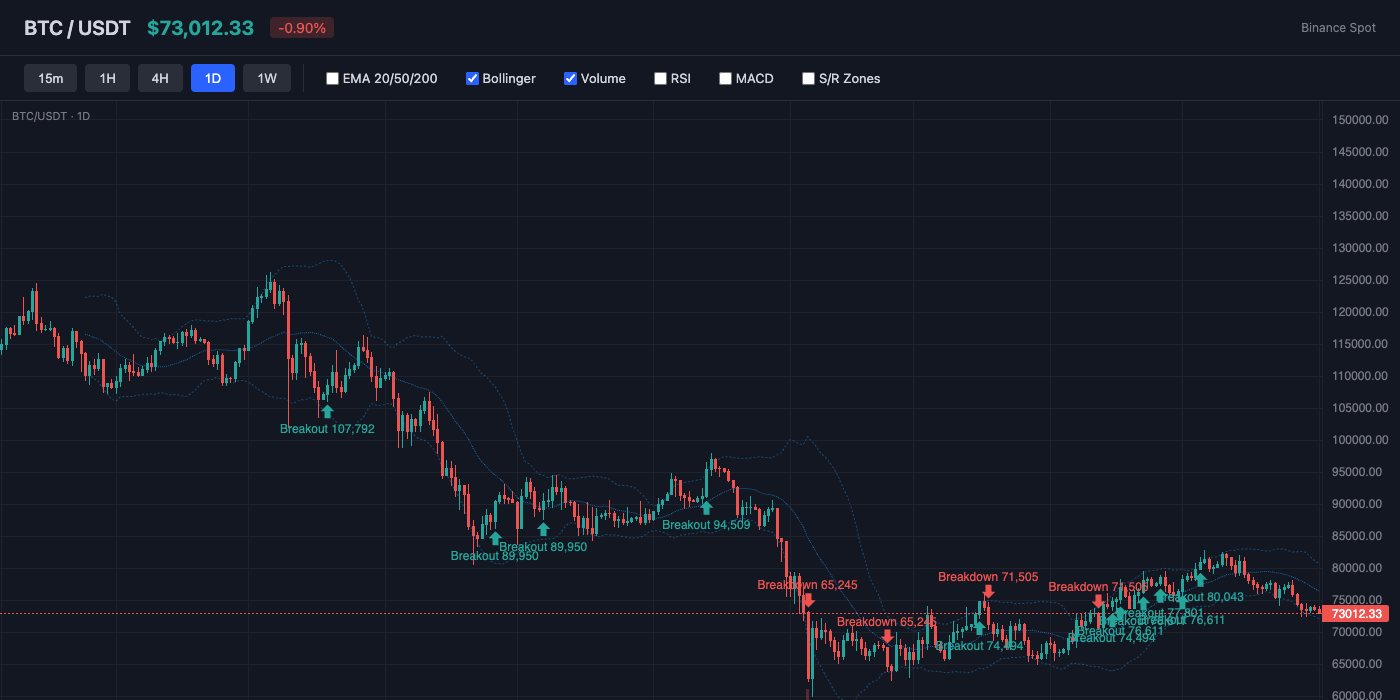
Bollinger Bands show a bandwidth of 11.2% (moderate volatility). Price hugs the lower band (%B: 12%), indicating oversold conditions or persistent selling. The middle band (SMA 20) at $76,444 acts as dynamic resistance.
Momentum Indicators
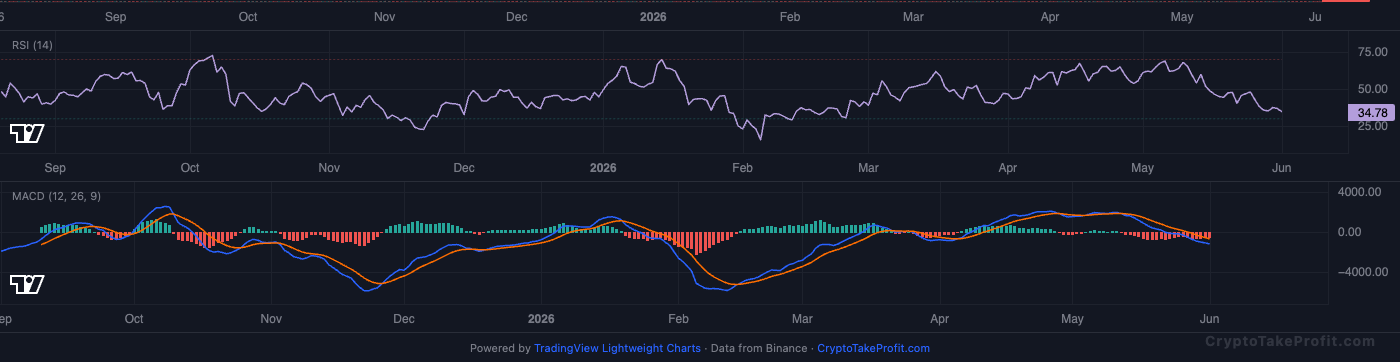
RSI reads 37.3, showing bearish pressure but approaching oversold. MACD has no active crossover, with negative histogram (-485.00) indicating downward pressure.
Market Structure
BTC is trading at $73,173 with a conflicted neutral bias.
Volume Analysis
Volume is at 0.54x the 20-day average, indicating normal activity.
Key Levels
| Price | Type | Source | Significance | Distance |
|---|---|---|---|---|
| $80,730 | Resistance | BB Upper | Low | +10.3% |
| $77,801 | Resistance | Pivot R3 | Low | +6.3% |
| $76,611 | Resistance | Pivot R2 | Medium | +4.7% |
| $74,892 | Resistance | Pivot R1 | Medium | +2.3% |
| $73,173 | Current | — | — | — |
| $71,984 | Support | Pivot S1 | Medium | -1.6% |
| $70,794 | Support | Pivot S2 | Medium | -3.3% |
| $69,075 | Support | Pivot S3 | Low | -5.6% |
Moving Averages
| MA | Value | Position | Signal |
|---|---|---|---|
| EMA 20 | $76,286 | Below | Bearish |
| EMA 50 | $76,086 | Below | Bearish |
| EMA 200 | $83,434 | Below | Bearish |
| BB Middle (SMA 20) | $76,444 | Below | Bearish |
Trade Setup
BTC Scenario Analysis
Bullish Case
Trigger: N/A
Target: N/A
Invalidation: N/A
Base Case
Trigger: N/A
Target: N/A
Invalidation: N/A
Bearish Case
Trigger: N/A
Target: N/A
Invalidation: N/A
Bitcoin (BTC) Resources
Altcoin Overview
Among altcoins, BNB leads with the strongest neutral signal (score: 35), while AVAX shows the weakest setup (score: -35). Traders should focus on coins with clear directional signals and volume confirmation.
What to Watch
- BTC $73,173: RSI 37.3 approaches oversold; break below $72,000 triggers next leg down.
- ETH $1,988: below psychological $2,000; last close above $2,050 was February 24.
- SOL $81.47: Shooting Star pattern on daily; $78.00 support holds January low.
- BNB $693.00: Shooting Star at all-time high area; volume down 34% since February 26.
- XRP $1.31: RSI 38.5 with no pattern; $1.25 is 200-day moving average per TradingView.