BTC at $77,175 — Daily Crypto Technical Analysis (September 13, 2026)
BTC at $77,175 (bullish) with chart analysis, futures data, and scenario breakdown. ETH, SOL, and top altcoins analyzed.
Market Overview
The crypto market fell 3.7% to a $2.63T market cap as of September 13, 2026, while BTC dominance stands at 58.8%, according to the supplied market data. Fear & Greed is 61 (Greed), showing risk appetite remains positive despite the pullback; BTC at $77,175 with RSI 54.5 indicates a mild bullish bias, while dominance at 58.8% keeps Bitcoin relatively strong versus altcoins.
Bitcoin (BTC) — $77,175
▲ WEAK BULLISH (Score: 20)
Price Action & Key Levels
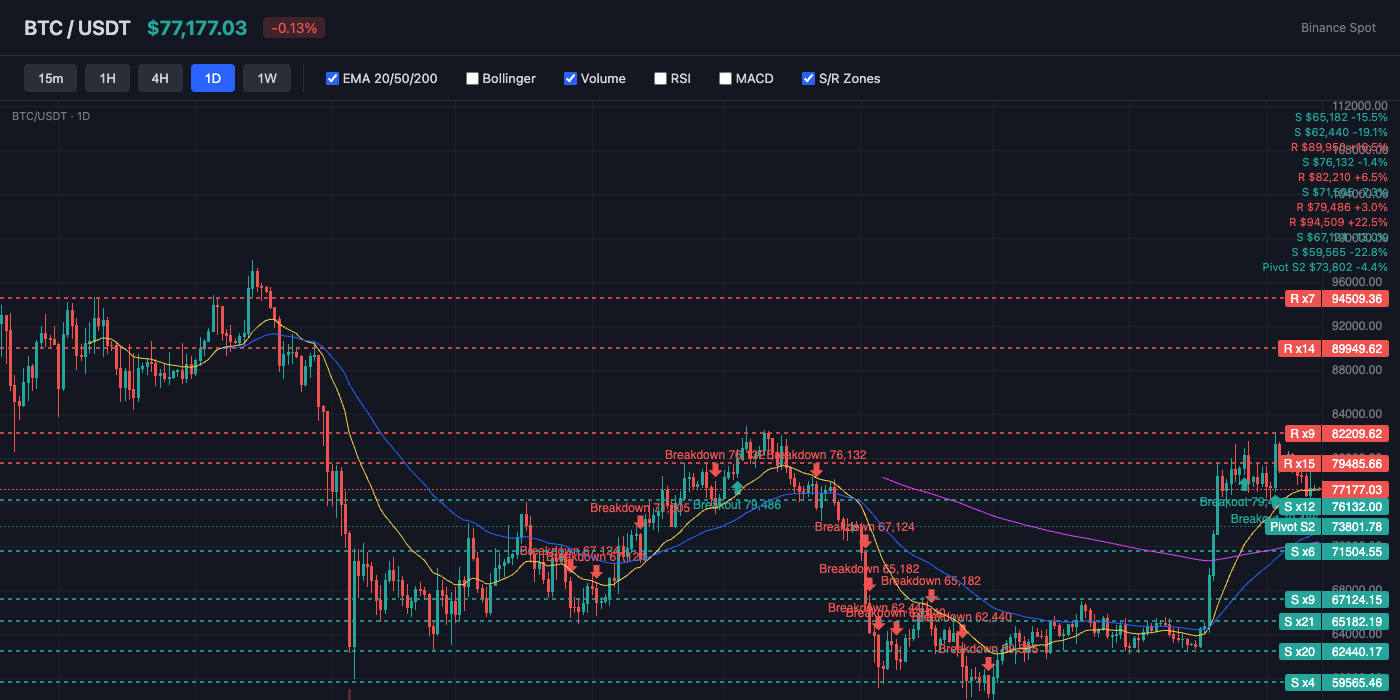
Bitcoin trades at $77,175, currently above the 20-day EMA ($76,942) and above the 50-day EMA ($73,246). The 200-day EMA at $72,476 serves as long-term support. Key resistance sits at $79,378 (Pivot R1), while support holds at $76,446 (BB Lower). All three EMAs are aligned bullishly (20 > 50 > 200), confirming the uptrend structure.
Bollinger Bands & Volatility
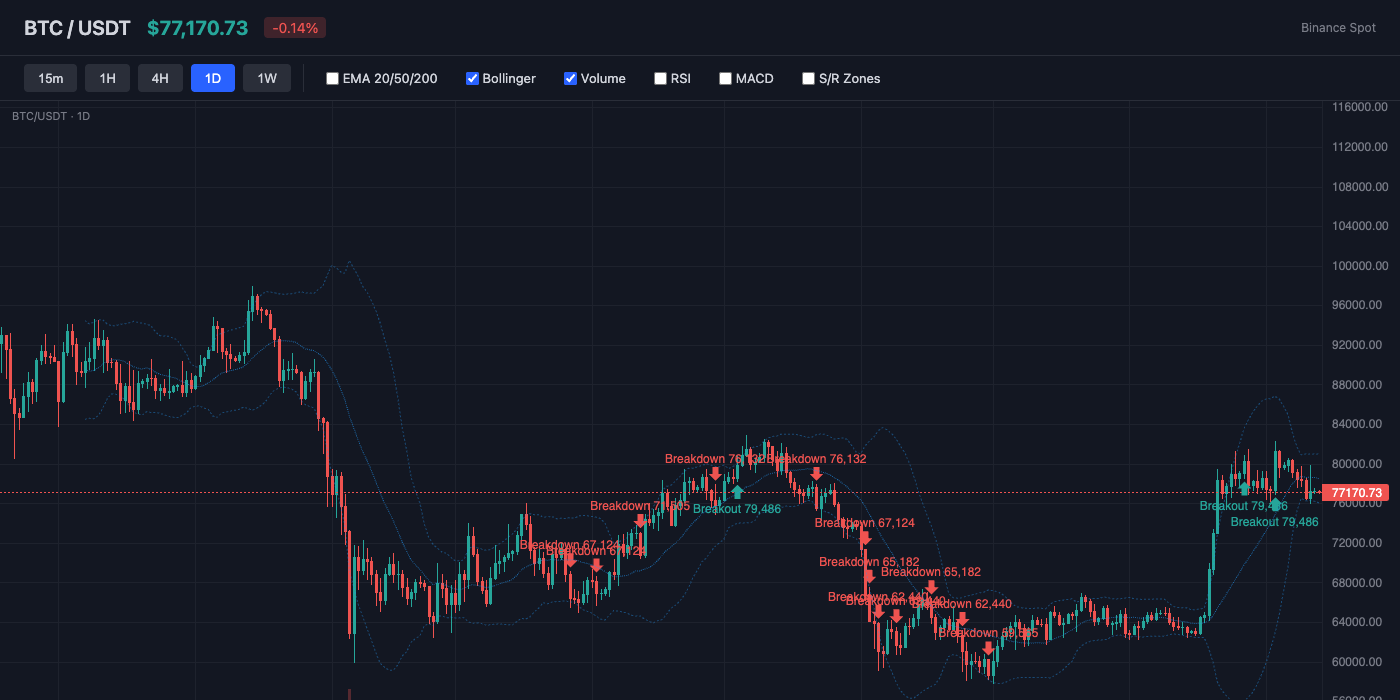
Bollinger Bands show a bandwidth of 5.6% (moderate volatility). Price hugs the lower band (%B: 17%), indicating oversold conditions or persistent selling. The middle band (SMA 20) at $78,638 acts as dynamic resistance.
Momentum Indicators
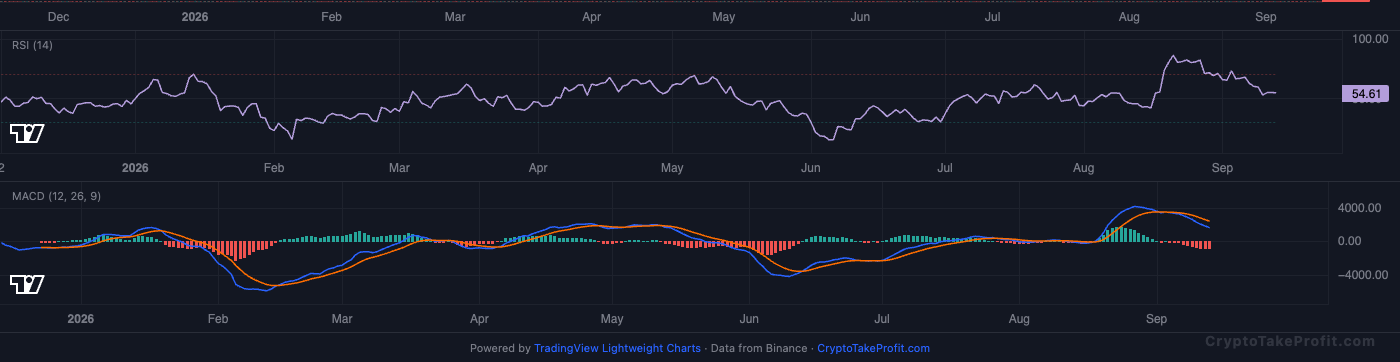
RSI reads 54.5, sitting in neutral range with no extreme readings. MACD has no active crossover, with negative histogram (-747.54) indicating downward pressure.
Market Structure
Bitcoin trades at $77,175, holding above the 20-day EMA of $76,942 but confronting a negative MACD histogram that signals waning momentum. The composite signal reads 20 (weak bullish), while the long/short ratio sits at 2.22 and the Fear & Greed Index registers 61 (greed) as of March 2026. Price is wedged between the Bollinger Band lower support at $76,446 and pivot resistance at $79,378, with the 50-day EMA far below at $73,246 providing structural floor.
Volume Analysis
Volume runs at just 0.19x the average, a severe contraction that undercuts the credibility of the current price level. Per CoinMarketCap data, Bitcoin's market cap has slipped to $2.63 trillion, down 3.7% over the period. The thin tape means any directional move lacks broad participation and is vulnerable to outsized slippage on relatively small order flow.
Key Levels
| Price | Type | Source | Significance | Distance |
|---|---|---|---|---|
| $83,267 | Resistance | Pivot R3 | Low | +7.9% |
| $81,580 | Resistance | Pivot R2 | Medium | +5.7% |
| $79,378 | Resistance | Pivot R1 | Medium | +2.9% |
| $77,175 | Current | — | — | — |
| $76,446 | Support | BB Lower | Low | -0.9% |
| $75,488 | Support | Pivot S1 | Medium | -2.2% |
| $73,802 | Support | Pivot S2 | Medium | -4.4% |
| $72,476 | Support | EMA200 | High | -6.1% |
Moving Averages
| MA | Value | Position | Signal |
|---|---|---|---|
| EMA 20 | $76,942 | Above | Bullish |
| EMA 50 | $73,246 | Above | Bullish |
| EMA 200 | $72,476 | Above | Bullish |
| BB Middle (SMA 20) | $78,638 | Below | Bearish |
Trade Setup
BTC Scenario Analysis
Bullish Case
Trigger: A daily close above $79,378 (pivot R1) on volume expansion above 1.0x average.
Target: $83,500
Invalidation: A daily close below $76,446 (BB lower support).
The bullish case rests on RSI at 54.5 leaving room to run before overbought territory, while the 20-day EMA at $76,942 acts as a near-term springboard. Per CryptoQuant data from March 24, 2026, exchange netflow registered -1,165 BTC, marking three consecutive outflow days that imply accumulation. A sustained breakout above $79,378 with rising open interest would confirm the transition.
Base Case
Trigger: Price oscillates between $76,446 and $79,378 without a decisive volume surge.
Target: $76,500 to $79,200 range
Invalidation: A breakdown below $76,446 or breakout above $79,400 on volume exceeding 1.5x average.
The base case reflects a market in limbo, with the funding rate at 0.0072% signaling mild long bias but open interest at 103,846 contracts offering no clear directional commitment. Fear & Greed at 61 (greed) historically precedes consolidation phases rather than immediate reversals. CryptoQuant data from March 24 shows funding turning positive after a week of negative values, consistent with a market resolving uncertainty rather than forming a trend.
Bearish Case
Trigger: A daily close below $76,446 (BB lower support) accompanied by volume above 1.2x average.
Target: $73,246 (EMA50)
Invalidation: A daily close back above $79,378.
The bearish scenario gains traction if the negative MACD histogram translates into price losing the Bollinger lower band, exposing the 50-day EMA at $73,246 as the next magnet. ATR at $2,254 means a single daily candle can cover the distance between current price and that target. Historically, per HTX Insights data from March 2026, extreme fear readings near 8 have preceded cycle bottoms, but the current greed reading of 61 leaves sentiment vulnerable to a sharp reset.
Bitcoin (BTC) Resources
Altcoin Overview
Among altcoins, XRP leads with the strongest bullish signal (score: 20), while AVAX shows the weakest setup (score: -25). Traders should focus on coins with clear directional signals and volume confirmation.
What to Watch
- BTC at $77,175: RSI 54.5 keeps the signal WEAK bullish as of September 13, 2026.
- ETH at $2,515: RSI 62.0 conflicts with its -2 score and WEAK bearish signal.
- SOL at $101.32: RSI 56.6 supports its WEAK bullish score of 10 on September 13.
- XRP at $1.36: RSI 52.2 matches its WEAK bullish score of 20.
- AVAX at $7.41: RSI 50.7 sits near neutral alongside its -25 WEAK bearish score.