Ethereum (ETH) Interactive Chart Analysis — September 13, 2026
ETH at $2,493 — interactive chart with EMA, BB, RSI, MACD, S/R levels. WEAK bullish signal (10). Funding rate 0.0038%.
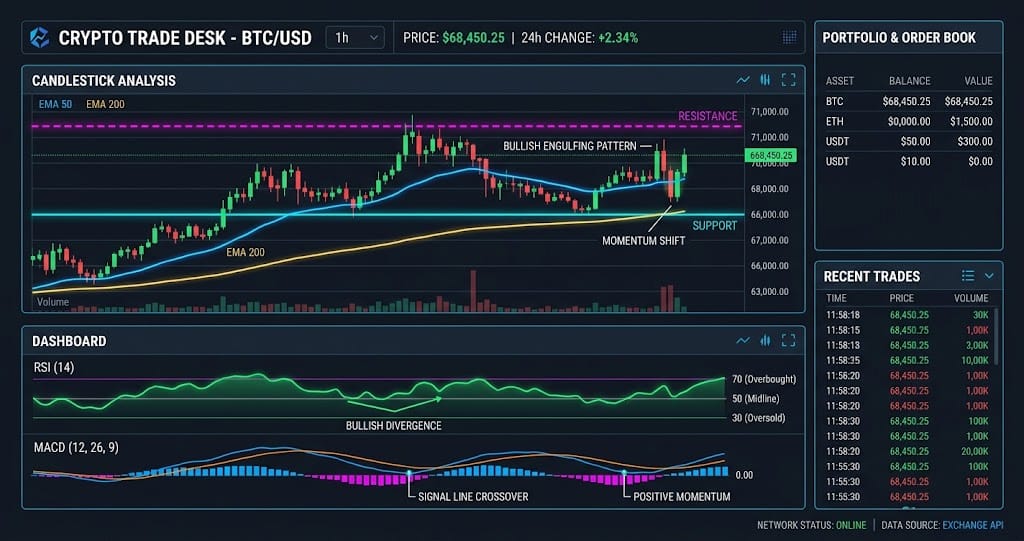
Interactive chart — switch timeframes, toggle indicators, hover for OHLC data
Market Structure
Ethereum trades at $2,493 as of September 13, 2026, holding above the 20-day EMA at $2,430 but facing a firm ceiling at the $2,567 swing high. The signal reading of 10 (weak bullish) is backed by a rising EMA structure — EMA20 at $2,430 sits well above EMA50 at $2,254 — yet RSI at 59.7 and a negative MACD histogram point to fading momentum. According to Gate market data, ETH/USDT printed $2,498.99 on September 13 with a 24-hour decline of 1.16%- 1 .
Key Levels
| Price | Type | Source | Significance | Distance |
|---|---|---|---|---|
| $2,900 | Resistance | Pivot R3 | Low | +16.3% |
| $2,784 | Resistance | Pivot R2 | Medium | +11.7% |
| $2,638 | Resistance | Pivot R1 | Medium | +5.8% |
| $2,567 | Resistance | Swing High | High | +3.0% |
| $2,493 | Current | — | — | — |
| $2,430 | Support | EMA20 | Low | -2.5% |
| $2,404 | Support | BB Lower | Low | -3.5% |
| $2,376 | Support | Pivot S1 | Medium | -4.7% |
| $2,260 | Support | Pivot S2 | Medium | -9.3% |
Moving Averages
| MA | Value | Position | Signal |
|---|---|---|---|
| EMA 20 | $2,430 | Above | Bullish |
| EMA 50 | $2,254 | Above | Bullish |
| EMA 200 | $2,199 | Above | Bullish |
| BB Middle (SMA 20) | $2,478 | Above | Bullish |
Volume Analysis
Volume ratio at 0.38x average is the weakest confirmation in this setup. That contraction means the recent push toward $2,500 drew little participation, and without a volume expansion above 1.0x, a breakout through $2,567 lacks the fuel to sustain. Coinglass data from September 12 showed $303.98 million in short liquidations that briefly lifted ETH to $2,534.27 — a mechanical squeeze, not organic accumulation- 24 .
Technical Indicators
Trade Setup
Scenario Analysis
Bullish Case
Trigger: A daily close above $2,567 with volume ratio expanding past 1.0x.
Target: $2,750
Invalidation: A daily close below $2,430 (EMA20).
If buyers absorb the $2,567 supply zone, the next measured move targets $2,750, roughly a 10% advance from current levels. The long/short ratio at 1.27 and funding at just 0.0038% leave room for a spot-led rally without immediate crowding risk.
Base Case
Trigger: Price continues oscillating between $2,430 and $2,567 without a volume catalyst.
Target: $2,430–$2,560 range
Invalidation: A breakdown below $2,400 or a breakout above $2,600 on rising volume.
The 0.38x volume ratio and neutral funding rate favor a prolonged consolidation, with BB %B at 60.2% leaving bandwidth for chop. Per Gate Square analysis, ETH is in a post-spike digestion phase where rebounds are technical rather than trend-defining- 11
Bearish Case
Trigger: A daily close below $2,430, confirmed by a volume ratio above 1.0x.
Target: $2,254 (EMA50)
Invalidation: A reclaim of $2,500 on expanding volume.
Losing $2,430 opens a direct path to the 50-day EMA at $2,254, a 9.6% decline from $2,493. The negative MACD histogram and the large-holder long/short ratio at 2.23 — described as a crowded, fragile structure — increase the odds of a long-squeeze cascade if support breaks- 20
Analysis Summary
Ethereum (ETH) Resources