Ethereum (ETH) Interactive Chart Analysis — July 11, 2026
ETH at $1,802 — interactive chart with EMA, BB, RSI, MACD, S/R levels. WEAK bullish signal (10). Funding rate 0.0024%.
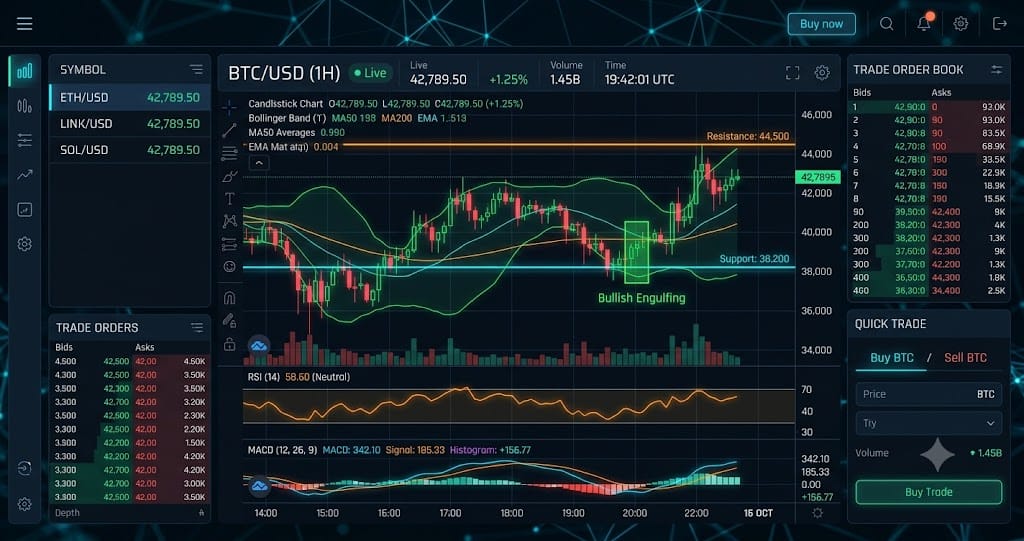
Interactive chart — switch timeframes, toggle indicators, hover for OHLC data
Market Structure
ETH trades at $1,802 with a WEAK bullish signal score of 10, while RSI at 57.0 and a positive MACD histogram indicate improving momentum as of July 2026. Price is above the EMA20 at $1,732 and testing the EMA50 at $1,800, with Pivot R1 resistance at $1,853 and no active chart pattern identified. Funding rate at 0.0024% and a long/short ratio of 1.41 show traders hold a modest long bias.
Key Levels
| Price | Type | Source | Significance | Distance |
|---|---|---|---|---|
| $2,346 | Resistance | EMA200 | High | +30.1% |
| $1,973 | Resistance | Pivot R3 | Low | +9.5% |
| $1,903 | Resistance | Pivot R2 | Medium | +5.6% |
| $1,853 | Resistance | Pivot R1 | Medium | +2.8% |
| $1,802 | Current | — | — | — |
| $1,800 | Support | EMA50 | Medium | -0.1% |
| $1,733 | Support | Pivot S1 | Medium | -3.9% |
| $1,663 | Support | Pivot S2 | Medium | -7.7% |
| $1,613 | Support | Pivot S3 | Low | -10.5% |
Moving Averages
| MA | Value | Position | Signal |
|---|---|---|---|
| EMA 20 | $1,732 | Above | Bullish |
| EMA 50 | $1,800 | Above | Bullish |
| EMA 200 | $2,346 | Below | Bearish |
| BB Middle (SMA 20) | $1,688 | Above | Bullish |
Volume Analysis
ETH volume is running at 0.25x the average, which limits confirmation of the current upward move. The low volume level suggests buyers have not yet shown enough participation to validate a breakout above the $1,853 Pivot R1 resistance. A sustained move above $1,853 with volume increasing above the current 0.25x ratio would confirm stronger demand.
Technical Indicators
Trade Setup
Scenario Analysis
Bullish Case
Trigger: ETH closes above $1,853 with volume expanding above the current 0.25x average
Target: $1,950
Invalidation: $1,732
ETH holding above $1,853 would confirm that buyers have absorbed resistance, while the RSI at 57.0 leaves room for further upside before reaching overbought conditions. The bullish case remains valid while price stays above the EMA20 at $1,732 and open interest remains supported at 2,289,576 contracts.
Base Case
Trigger: ETH remains between $1,732 and $1,853 while volume stays below 0.50x average
Target: $1,750-$1,850
Invalidation: $1,732
ETH is likely to consolidate because price is positioned between the EMA20 at $1,732 and Pivot R1 at $1,853 without strong volume confirmation. The base case remains active if ETH holds the $1,800 area and the long/short ratio stays near the current 1.41 level.
Bearish Case
Trigger: ETH breaks below $1,732 with rising sell volume
Target: $1,650
Invalidation: $1,853
ETH would shift bearish if the EMA20 support at $1,732 fails, as current bullish momentum would weaken and sellers could target lower support. The bearish scenario is confirmed if ETH closes below $1,732 while volume rises above the current 0.25x average.
Analysis Summary
Ethereum (ETH) Resources