Ethereum (ETH) Interactive Chart Analysis — August 31, 2026
ETH at $2,445 — interactive chart with EMA, BB, RSI, MACD, S/R levels. WEAK bullish signal (25). Funding rate 0.0003%.
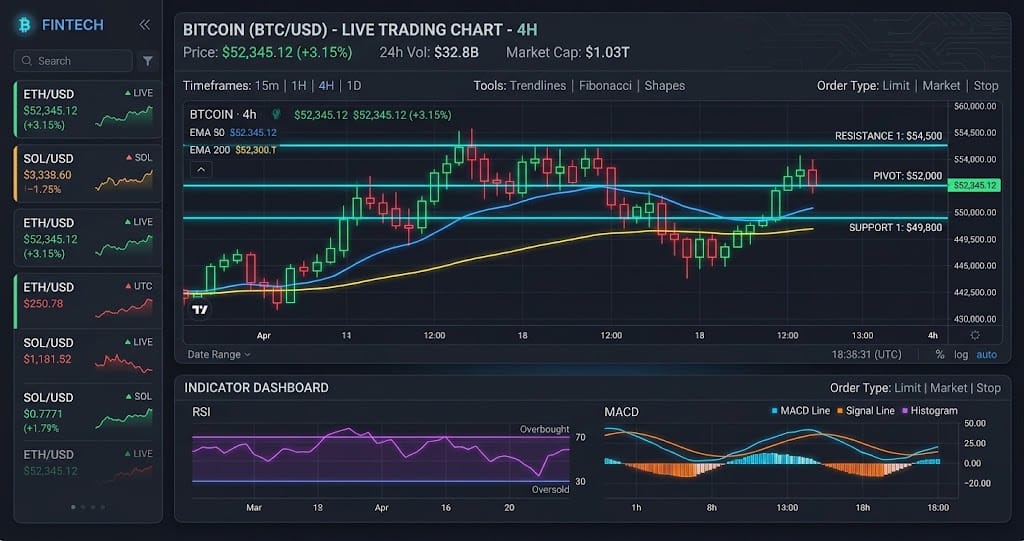
Interactive chart — switch timeframes, toggle indicators, hover for OHLC data
Market Structure
ETH trades at $2,445 with a Signal of 25, indicating a WEAK bullish structure, while price remains above the EMA20 at $2,275 and EMA50 at $2,097 based on the provided indicator data as of August 31, 2026. RSI at 70.8 shows stretched momentum, while BB %B at 69.8% places price in the upper portion of its recent volatility range; the key structure remains support at $2,366 versus resistance at $2,545.
Key Levels
| Price | Type | Source | Significance | Distance |
|---|---|---|---|---|
| $2,765 | Resistance | BB Upper | Low | +13.1% |
| $2,724 | Resistance | Pivot R3 | Low | +11.4% |
| $2,646 | Resistance | Pivot R2 | Medium | +8.2% |
| $2,545 | Resistance | Pivot R1 | Medium | +4.1% |
| $2,445 | Current | — | — | — |
| $2,366 | Support | Pivot S1 | Medium | -3.2% |
| $2,287 | Support | Pivot S2 | Medium | -6.4% |
| $2,187 | Support | Pivot S3 | Low | -10.6% |
| $2,097 | Support | EMA50 | Medium | -14.2% |
Moving Averages
| MA | Value | Position | Signal |
|---|---|---|---|
| EMA 20 | $2,275 | Above | Bullish |
| EMA 50 | $2,097 | Above | Bullish |
| EMA 200 | $2,166 | Above | Bullish |
| BB Middle (SMA 20) | $2,235 | Above | Bullish |
Volume Analysis
The volume ratio is only 0.78x average, according to the provided volume data, so the move toward $2,545 lacks above-average participation. Funding at 0.0003% remains low, while the Long/Short Ratio of 1.59 and Open Interest of 2,352,328 contracts show a long bias that needs stronger volume confirmation above $2,545.
Technical Indicators
Trade Setup
Scenario Analysis
Bullish Case
Trigger: A sustained break above $2,545 with volume rising above 1.00x average.
Target: $2,631
Invalidation: A close below $2,445.
ETH's bullish case remains valid because $2,445 trades $170 above the EMA20 and $348 above the EMA50, according to the provided indicator data as of August 31, 2026. A $2,545 breakout would extend the move by roughly one ATR of $85.68 toward $2,631, while RSI at 70.8 means momentum must overcome an already stretched condition.
Base Case
Trigger: Price remains between $2,366 support and $2,545 resistance while volume stays below 1.00x average.
Target: $2,366-$2,545.
Invalidation: A sustained close above $2,545 with volume above 1.00x average or below $2,366.
This is the highest-probability scenario because ETH sits $179 between Pivot S1 at $2,366 and Pivot R1 at $2,545, while volume is only 0.78x average. RSI at 70.8 may limit immediate upside, while price holding above $2,366 would preserve the weak bullish structure.
Bearish Case
Trigger: A break below $2,366, especially if RSI falls below 70 and selling volume exceeds 1.00x average.
Target: $2,275.
Invalidation: A recovery above $2,445.
A loss of $2,366 would break the nearest support and expose the EMA20 at $2,275, a $91 decline from support, according to the provided indicator data as of August 31, 2026. The 1.59 Long/Short Ratio creates downside vulnerability if leveraged longs unwind, while a return above $2,445 would weaken the bearish setup.
Analysis Summary
Ethereum (ETH) Resources