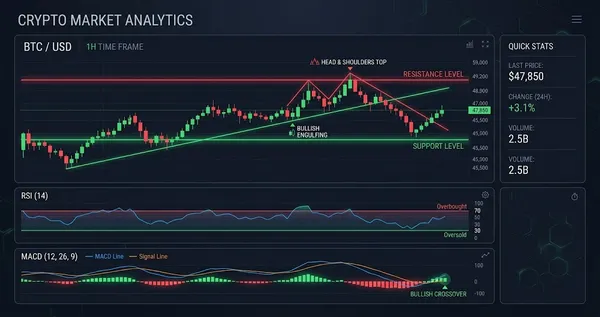
UNI Surges 10.2% — Technical Analysis Alert
UNI surged 10.2% to $5.80. Full technical analysis with support/resistance levels and trade setup.
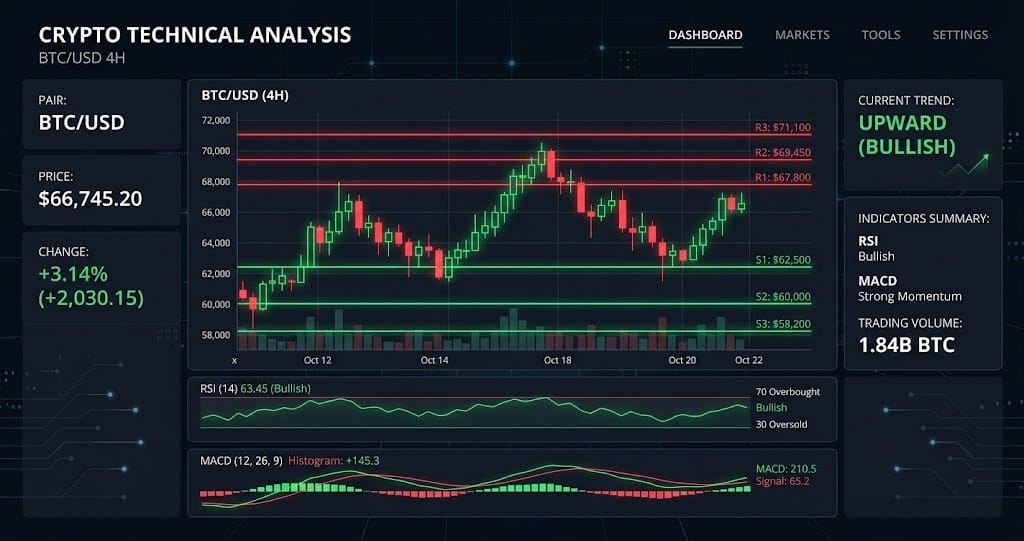
Analysis
UNI surged 10.2% to $5.80, while RSI reached 79.0, indicating short-term overbought conditions. With no MACD signal and a technical score of 10 classified as CONFLICTED neutral, the move may reflect broad crypto market momentum or increased buying interest around Uniswap. As of September 1, 2026, the available technical data does not identify a confirmed fundamental catalyst. Support sits at $5.55, marked by the Bollinger Band upper level, while resistance stands at $6.29 at Pivot R1. If UNI breaks below $5.55, the failed breakout could trigger a deeper pullback; if $6.29 flips into support, buyers would have cleared the immediate technical barrier. With RSI at 79.0 and no confirmed pattern, $5.55 and $6.29 are the key falsifiable levels.
Support & Resistance
| Level | Price | Distance |
|---|---|---|
| Pivot R3 | $7.76 | +33.9% |
| Pivot R2 | $6.79 | +17.1% |
| Pivot R1 | $6.29 | +8.5% |
| Current Price | $5.80 | — |
| BB Upper | $5.55 | -4.3% |
| Pivot S1 | $4.83 | -16.8% |
| EMA20 | $4.42 | -23.8% |
| EMA50 | $4.00 | -31.0% |