Solana (SOL) Interactive Chart Analysis — August 31, 2026
SOL at $103.16 — interactive chart with EMA, BB, RSI, MACD, S/R levels. CONFLICTED neutral signal (15). Funding rate -0.0045%.
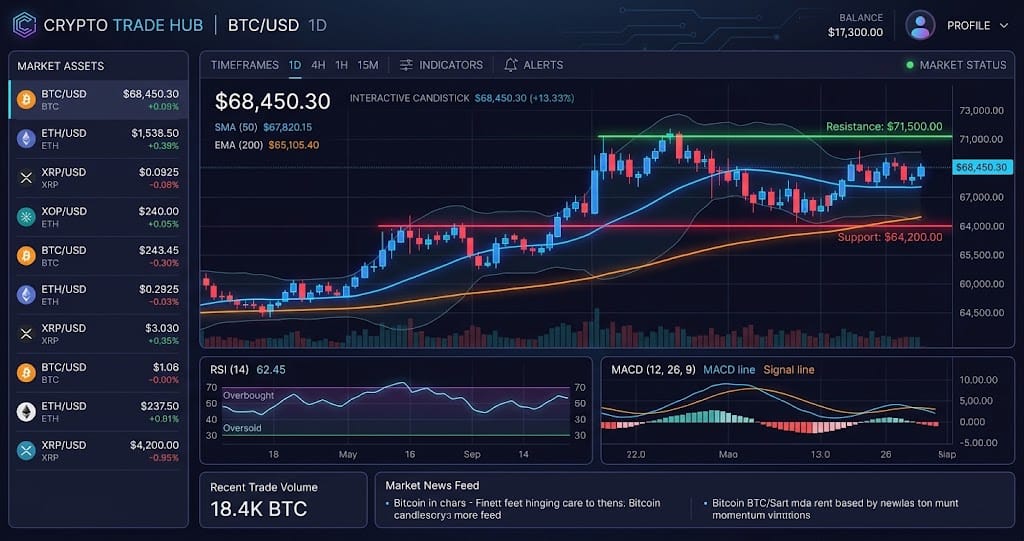
Interactive chart — switch timeframes, toggle indicators, hover for OHLC data
Market Structure
SOL trades at $103.16, sitting 11.4% above its EMA20 of $92.63 and 21.5% above its EMA50 of $84.91. RSI at 72.8 signals overbought conditions, yet the funding rate at -0.0045% suggests shorts are paying longs, a bearish divergence against the price strength. Open interest of 8.32 million contracts and a long/short ratio of 2.12 indicate heavy long positioning, creating a crowded trade that may fuel either a squeeze or a flush.
Key Levels
| Price | Type | Source | Significance | Distance |
|---|---|---|---|---|
| $125.82 | Resistance | Pivot R3 | Low | +22.0% |
| $118.21 | Resistance | Pivot R2 | Medium | +14.6% |
| $113.75 | Resistance | BB Upper | Low | +10.3% |
| $110.69 | Resistance | Pivot R1 | Medium | +7.3% |
| $103.16 | Current | — | — | — |
| $95.56 | Support | Pivot S1 | Medium | -7.4% |
| $92.63 | Support | EMA20 | Low | -10.2% |
| $89.78 | Support | EMA200 | High | -13.0% |
| $87.95 | Support | Pivot S2 | Medium | -14.7% |
Moving Averages
| MA | Value | Position | Signal |
|---|---|---|---|
| EMA 20 | $92.63 | Above | Bullish |
| EMA 50 | $84.91 | Above | Bullish |
| EMA 200 | $89.78 | Above | Bullish |
| BB Middle (SMA 20) | $89.90 | Above | Bullish |
Volume Analysis
Volume at 0.91x the 30-day average shows below-conviction participation, failing to confirm the recent move above $100. The ATR of $4.83 implies daily moves of roughly 4.7%, but the low volume ratio weakens breakout credibility at current levels. Per the provided indicators, the 0.91x ratio paired with a positive MACD histogram suggests momentum without strong follower demand.
Technical Indicators
Trade Setup
Scenario Analysis
Bullish Case
Trigger: Price breaks and closes above pivot resistance R1 at $110.69 on volume exceeding 1.2x average over a 4-hour candle.
Target: $118.50 (measured move from the $95.56 support to $110.69 resistance, plus the breakout)
Invalidation: Price drops back below the EMA20 at $92.63 on any daily close.
A breakout above $110.69 would trigger stop-losses on the 2.12 long/short ratio, potentially sparking a short squeeze. However, the 0.91x volume and overbought RSI cap the upside; the target of $118.50 represents the next logical Fibonacci extension from the recent range.
Base Case
Trigger: Price oscillates between the S1 support at $95.56 and R1 resistance at $110.69 over the next 5-7 trading sessions, with volume staying below 1.0x average.
Target: Range-bound between $96.00 and $110.00, with the EMA20 at $92.63 rising to meet the lower bound.
Invalidation: A daily close above $110.69 or below $95.56, confirmed by a volume ratio above 1.1x.
The negative funding rate and positive MACD histogram create conflicting forces, favoring a consolidation to work off the RSI 72.8 overbought reading. Open interest at 8.32 million contracts remains elevated, suggesting neither side has the momentum to force a decisive break without a volume catalyst.
Bearish Case
Trigger: Price loses the pivot S1 support at $95.56 on a daily close, with volume ratio rising above 1.0x as sellers enter.
Target: $84.91 (the EMA50 level), a 17.7% drop from current price.
Invalidation: Price reclaims $103.16 (current spot) within 24 hours of the breakdown.
A break below $95.56 would unwind the crowded 2.12 long/short ratio, accelerating downside toward the EMA50 at $84.91. The already-negative funding rate at -0.0045% and subpar volume suggest buyers are exhausted, making this the highest-probability directional move if support fails.
Analysis Summary
Solana (SOL) Resources