Lighter (LIT) Spotlight — June 3, 2026
In-depth Lighter spotlight: $1.78 price, +36.0% 24h change, technical analysis, pros/cons, and market outlook.
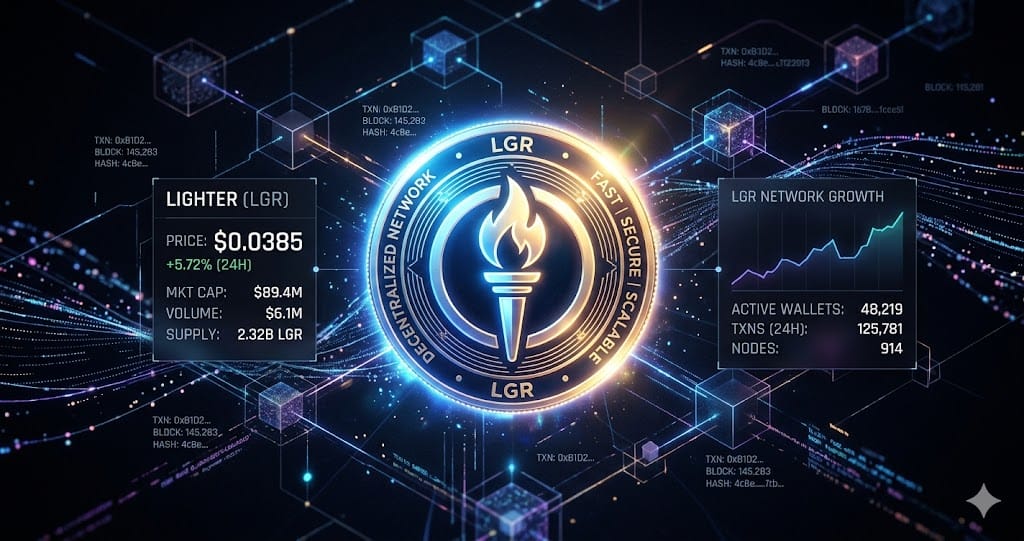
Lighter (LIT) is trading at $1.78, up 36% in 24 hours and 87.2% over 30 days, with a $442.0 million market cap per CoinGecko as of June 3, 2026. The protocol is a decentralized perpetual futures exchange built as an Ethereum zk-Rollup, claiming sub-5ms matching latency and verifiable order book execution via ZK-SNARK proofs.
LIT remains 77.6% below its December 30, 2025 all-time high of $7.86 per Bybit data. Total disclosed funding reached $80 million across Seed and Series A rounds, led by Founders Fund and Ribbit Capital at a $1.5 billion valuation. The circulating supply is 250 million tokens as of June 2026 — 25% of the 1 billion total. Ecosystem incentives account for 41.4% of total supply, with 4.8% allocated to the initial airdrop.
What Is Lighter?
Lighter (LIT) is a decentralized exchange built on Ethereum that matches the speed of centralized platforms like Binance while keeping trades fully verifiable on-chain. Per HTX Insights, Lighter uses zero-knowledge rollup technology to generate cryptographic proofs for every order match and liquidation, hitting millisecond latency and over 10,000 transactions per second. Most DEXs sacrifice one for the other. The platform supports market, limit, stop-loss, and TWAP orders with price-time priority matching, and offers up to 50x leverage on more than 50 perpetual markets.
The exchange operates on a zero-fee model for retail traders, generating revenue from institutional API users. Its architecture pairs a sequencer for order batching with a prover generating zk-SNARK proofs, while smart contracts hold custody of all funds. An "Exit Hatch" mechanism lets users withdraw directly through Ethereum if the sequencer fails, preserving non-custodial security. As of February 2026, DefiLlama data shows Lighter has $925.8 million in total value locked and has processed over 59 billion transactions across 801,000 users. The protocol completed a $68 million Series A in November 2025 led by Founders Fund and Ribbit Capital at a $1.5 billion valuation.
Key Features
- Blockchain Technology: Built on a robust blockchain infrastructure designed for security and scalability
- Active Development: Regular updates and improvements from a dedicated development team
- Community: Growing community of users, developers, and supporters worldwide
- Market Presence: Ranked #115 with $442.0M market capitalization
- Trading Volume: $150.4M in 24-hour trading volume indicates healthy market interest
Use Cases
- Decentralized Exchange (DEX) applications and use cases
- Decentralized Finance (DeFi) applications and use cases
- Derivatives applications and use cases
- Perpetuals applications and use cases
- Ethereum Ecosystem applications and use cases
Pros & Cons
✅ Pros
- Strong market position at rank #115 with $442.0M market cap
- Active trading volume of $150.4M suggests healthy liquidity
- Positioned in growing sectors: Decentralized Exchange (DEX), Decentralized Finance (DeFi), Derivatives, Perpetuals, Ethereum Ecosystem
- Listed on major exchanges ensuring accessibility for traders
❌ Cons
- Currently -77.6% from all-time high of $7.86
- Cryptocurrency markets are highly volatile and unpredictable
- Regulatory uncertainty could impact price and adoption
- Competition from other projects in the same space
Price Outlook
Bitcoin Network Activity vs. Price: Divergence or Signal?
Daily active addresses on Bitcoin have fallen 44% since May 2021, dropping from 1.12 million to approximately 624,000 as of June 2026. New wallet creations declined 43% over the same period, from 489,000 to 278,000 per day. Santiment on-chain data confirms these figures, showing network growth has not kept pace with price levels that remain above previous cycle highs.
Yet Bitcoin traded near $66,000 to $69,500 on June 2-3, 2026, down from its October 2025 all-time high of $126,296 but still substantially above the 2021 peak of $69,000. This divergence suggests ETF adoption may be decoupling network usage from market valuation. Institutional products now hold over $100 billion in assets, allowing price discovery without direct on-chain participation.
Supply Stress Signals Are Stacking
More than 40% of Bitcoin's circulating supply is held at a loss as of June 1, 2026. Long-term holders are experiencing a relative unrealized loss of 15.5%, with every dollar in their portfolios carrying roughly 15 cents in unrealized losses according to on-chain models. The True Market Mean sits at $78,000 while spot trades near $66,880, a gap of $11,120 that reflects significant market stress.
On June 2, 2026, approximately 10,300 BTC left Mt. Gox-linked wallets in the largest outflow from that cluster since March 11, 2025. Exchange reserves simultaneously rose, with Binance reaching 655,000 BTC and Bitfinex climbing from 406,000 to 415,000 BTC between May 18 and June 2. This combination of signals points to potential distribution pressure without confirming direct selling.
Liquidation Cascade and Market Structure
Bitcoin's drop to $65,000 on June 2-3, 2026 triggered over $1.8 billion in crypto liquidations across leveraged positions. The price broke below the $72,000-$74,000 support zone that defined May's market structure and now trades beneath the 50-day and 200-day moving averages. Technical analysts put the next major demand area at $64,500-$66,000, with some frameworks projecting downside to the low $40,000 range if the bear flag pattern completes its full measured move.
The MVRV Z-Score has flashed warnings consistent with late-cycle tops, and three consecutive red monthly candles through May 2026 have pushed the Fear and Greed Index into extreme fear territory near 23 to 26.
Specific metric to watch: The 50-week moving average relative to spot price over the next 14 trading days. A decisive weekly close below this level with expanding volume would confirm structural breakdown, while reclaiming it would suggest the current move is a correction within an ongoing bull market.
Lighter (LIT) Resources
Frequently Asked Questions
What is Lighter (LIT)?
Lighter is a cryptocurrency project ranked #115 by market cap. Lighter is a decentralized trading platform built for unmatched security and scale. It’s the first e
Is LIT a good investment?
Like all cryptocurrencies, LIT carries significant risk. It has a market cap of $442.0M and is -77.6% from its ATH. Always do thorough research before investing.
What is the current price of LIT?
As of this writing, LIT is trading at $1.78 with a 24-hour change of +36.0%.
Where can I buy LIT?
LIT is available on major exchanges including Binance, Coinbase, and Kraken. Always use reputable exchanges and enable 2FA for security.
Ready to start trading?
Trade on Bitget Try CoinTech2uAffiliate links — we may earn a commission at no extra cost to you.
Our Verdict
Bitcoin, Ethereum, Solana Price Analysis – June 3, 2026 Bitcoin: Below $66,000 Triggers $1.85B in Liquidations Bitcoin dropped to $65,400 on June 3, 2026, a 9% decline from the previous day's peak according to RBC reporting. It now trades at $66,973.64, down 4.87% in 24 hours per BlockchainReporter data. The 4-hour chart shows a bearish structure. Price sits below the EMA50 at $72,508 and EMA200 at $75,767 per analysis from Blockchain News. RSI at 14.43 signals extreme oversold conditions. Lower band support rests at $65,247. Liquidations totaled $1.85 billion across 278,000 traders, Coinglass data shows. Long positions absorbed $1.65 billion of that total. Bitcoin and Ethereum markets alone contributed nearly $1.3 billion in losses. Blackrock's IBIT ETF recorded a $388.6 million outflow on June 3, pointing to institutional selling pressure at current levels. Specific metric to watch: BTC holding below $66,000 with RSI under 20 for 24 consecutive hours indicates continued downside toward $63,500 major support. Ethereum: Breaks Below $1,815 for First Time Since February Ethereum fell to $1,815.82 on June 3, its lowest level since late February according to Binance price data. It trades at $1,867.11, down 5.48% over 24 hours with a market cap of $225.3 billion. 24-hour volume reached $28.4 billion. The hourly chart shows a breakdown. ETH broke below a contracting triangle with support at $1,975 on the Kraken feed. Price hit a low of $1,836 before consolidating. The 100-hourly Simple Moving Average now sits above price at approximately $1,950. From its all-time high of $4,953.73 on August 25, 2025, Ethereum has lost 62.3% of its value per Binance historical data. Total crypto market capitalization stands at $2.42 trillion, down 2.48%, with trading volume surging 76% to $113.5 billion. Specific metric to watch: ETH below $1,840 for two consecutive daily closes signals a test of $1,720 main support, the 2026 low. Solana: Tests Critical $73-$80 Support Zone Solana trades at $74.14, down 4.03% according to CoinDesk data. The price fell to approximately $73.50 on June 3, an 8.9% daily decline per Bitrue analysis of CoinGecko charts. Market structure shows Solana testing a support zone between $76 and $80. This range has held as a price floor since February within the ascending channel pattern. Parabolic SAR sits at $85.98 and Supertrend at $90.60, both above current price, confirming bearish momentum. Circulating supply remains 578 million SOL with market cap above $42 billion. Daily volume exceeds $4.2 billion, suggesting active selling rather than thin-market volatility. A weekly close below $76 invalidates the channel structure, with the next support at $68, last seen in October 2023. Specific metric to watch: SOL reclaiming $76 within 72 hours with volume above $5 billion indicates potential recovery toward $86. Below $76 heading into the June 7 weekly close confirms bearish continuation.
Related Articles
- BTC Crashes to USD 78,600: The May 2026 Liquidation Cascade Explained
- Crypto Market Sentiment Breakdown 2026: Fear, Funding Rates, and Macro Risk Signals Explained
- Worldcoin (WLD) in 2026: Complete Investor Guide & Price Analysis