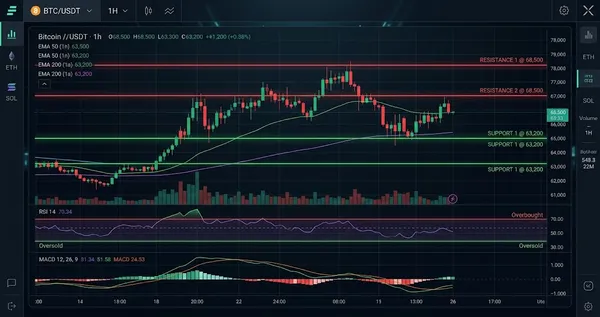
Solana (SOL) Interactive Chart Analysis — July 20, 2026
SOL at $76.23 — interactive chart with EMA, BB, RSI, MACD, S/R levels. WEAK bearish signal (-5). Funding rate -0.0048%.

Interactive chart — switch timeframes, toggle indicators, hover for OHLC data
Market Structure
SOL trades at $76.23 with a weak bearish signal score of -5 as of the latest data. The price sits slightly above the EMA20 at $76.12 but below the EMA50 at $76.65, showing short-term support is holding while the broader trend remains under pressure. RSI at 49.7 and BB %B at 28.5% indicate neutral momentum with price positioned in the lower half of the Bollinger range.
Key Levels
| Price | Type | Source | Significance | Distance |
|---|---|---|---|---|
| $98.01 | Resistance | EMA200 | High | +28.6% |
| $83.15 | Resistance | Pivot R3 | Low | +9.1% |
| $80.63 | Resistance | Pivot R2 | Medium | +5.8% |
| $78.43 | Resistance | Pivot R1 | Medium | +2.9% |
| $76.23 | Current | — | — | — |
| $76.12 | Support | EMA20 | Low | -0.1% |
| $73.71 | Support | Pivot S1 | Medium | -3.3% |
| $71.19 | Support | Pivot S2 | Medium | -6.6% |
| $68.99 | Support | Pivot S3 | Low | -9.5% |
Moving Averages
| MA | Value | Position | Signal |
|---|---|---|---|
| EMA 20 | $76.12 | Above | Bullish |
| EMA 50 | $76.65 | Below | Bearish |
| EMA 200 | $98.01 | Below | Bearish |
| BB Middle (SMA 20) | $78.25 | Below | Bearish |
Volume Analysis
Volume is weak, with the volume ratio at 0.62x average, showing limited participation behind current price action. The low volume confirms that neither buyers nor sellers have strong control, increasing the chance of consolidation around the $76.12 support level. ATR at $3.10 shows daily volatility remains elevated relative to the current price zone.
Technical Indicators
Trade Setup
Scenario Analysis
Bullish Case
Trigger: SOL breaks above $78.43 pivot resistance with volume ratio recovering above 1.0x average.
Target: $81.50
Invalidation: SOL falls below $76.12 EMA20 support.
A bullish scenario requires buyers to reclaim $78.43 and overcome the EMA50 at $76.65 with stronger volume. The negative MACD histogram would need improvement to confirm a shift toward positive momentum.
Base Case
Trigger: SOL holds between $76.12 support and $78.43 resistance while RSI remains between 45 and 55.
Target: $76.50-$78.00 range
Invalidation: SOL closes below $76.12 with increasing sell volume.
The base case is sideways trading because RSI at 49.7 and volume at 0.62x average show limited directional conviction. The doji pattern supports a market pause, with traders waiting for a breakout above $78.43 or breakdown below $76.12.
Bearish Case
Trigger: SOL breaks below $76.12 EMA20 support with volume rising above 1.0x average.
Target: $72.50
Invalidation: SOL reclaims $78.43 pivot resistance.
The bearish case remains active because the signal score is -5, the MACD histogram is negative, and SOL trades below the EMA50 at $76.65. A loss of $76.12 would expose the market to a deeper move toward the $72.50 area.
Analysis Summary
Solana (SOL) Resources