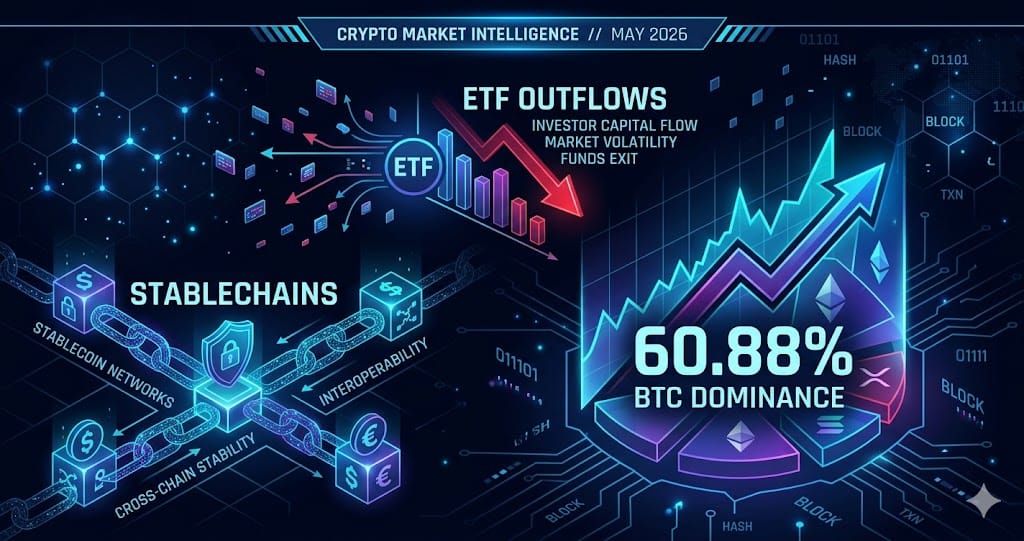
Stablechains, ETF Outflows, and BTC Dominance at 60.88%: May 2026
Bitcoin ETFs posted USD 1B in outflows May 11-15, BTC dominance hit 60.88%, and a new Stablechain L1 sector emerged around Plasma and Circle Arc.
Bitcoin ETFs recorded a net outflow of USD 1 billion in the week of May 11-15, 2026, snapping a six-week inflow streak that had peaked at USD 532 million in a single day on May 4. Simultaneously, BTC dominance broke through 60.88%, clearing an eight-month accumulation range between 58% and 60% that had held since August 2025.
Three concurrent signals — ETF demand cooling, a break below the 200-day moving average on May 21, and an Altcoin Season Index reading of 35 down from 39 the prior period — mark this week as a structural inflection point rather than routine volatility. Meanwhile, a distinct new sector called Stablechains is forming, with four projects competing to build L1 blockchains where stablecoins serve as gas and native unit of account.
Stablechains: A New L1 Category Built Around Stablecoins
Plasma (XPL), Stable, Tempo, and Circle Arc are the four projects analysts identified this week as forming the Stablechain sector — L1 blockchains that use stablecoins as the gas token and default accounting unit rather than a volatile native asset. Plasma is the only project with a fully live mainnet as of May 2026, processing billions in USDT that Tether issues natively on the chain rather than via bridging, with transaction checkpoints written directly to Bitcoin. It targets over 1,000 TPS and offers zero-fee transfers through Paymaster contracts.
The backdrop for this sector is global stablecoin transaction volume reaching USD 33 trillion annually by end-2025, generating demand for dedicated clearing infrastructure. Circle Arc is Circle's official entry, while Stable takes an aggressive approach by using USDT as gas with no independent L1 token at all. This narrative represents a structural upgrade from treating stablecoins as application-layer assets on general-purpose chains — the market is beginning to price dedicated stablecoin settlement layers as independent infrastructure with their own valuation logic.
Bitcoin ETF Outflows and the Break Below the 200-Day Moving Average
The week of May 11-15 saw Bitcoin spot ETFs register their largest weekly net outflow since February 2026, with USD 1 billion exiting funds including IBIT and FBTC. This reversed a six-week inflow streak that had accumulated approximately USD 2.44 billion in April alone. Analysts attributed the reversal to profit-taking, above-consensus US inflation data, and cautious Federal Reserve commentary that reduced broad risk appetite across asset classes.
Bitcoin broke below its 200-day moving average on May 21, 2026, as noted by CoinDesk. Demand from three historically reliable sources — ETF buyers, Coinbase spot purchasers, and South Korean retail traders — weakened simultaneously. This synchronized pullback from all three demand pillars matters because they had each been cited as key structural supports during the prior rally phase, and their concurrent withdrawal limits near-term recovery potential in ways that any single factor would not.
Hyperliquid Crosses USD 50 and Enters Prediction Markets
Hyperliquid's HYPE token broke through USD 50 this week, marking a year-to-date gain of 156% and pushing its market capitalization to USD 10.84 billion, placing it 14th globally by market cap. The protocol holds approximately 70% of on-chain perpetuals market share by volume, with monthly trading exceeding USD 180 billion. Its fee model routes 97% of trading revenue into HYPE buybacks and burns, creating a deflationary flywheel tied directly to exchange activity volume.
On May 5, 2026, Hyperliquid launched a native prediction market that generated USD 6 million in volume on its first day, competing directly with Polymarket and Kalshi, which each process between USD 2.1 billion and USD 2.7 billion weekly. This move extends Hyperliquid from its core perpetuals business into event contracts, adding a third narrative layer — prediction market entrant — on top of its existing DEX dominance and tokenomics story. HYPE has become the most-cited retail alpha target this week for traders looking outside Bitcoin's near-term headwinds.
PEPE ETF Filing, BTC Dominance, and the Shift Away from TVL
Canary Capital filed a spot PEPE ETF S-1 on April 8, 2026, marking the first formal intersection of meme coin assets and the US ETF regulatory process. PEPE holder addresses grew by 37,000 between mid-April and late May 2026 to reach 551,500, a 7.2% expansion in unique holders. The total meme coin market capitalization stands at USD 34.7 billion. Separately, the SEC and CFTC jointly rolled out a digital commodity taxonomy framework in May 2026, establishing the regulatory classification infrastructure needed to support broader asset-type ETF applications.
Solana DeFi TVL surged 2,300% year-over-year to USD 9.19 billion, compared to Ethereum's USD 71 billion, providing quantitative support for the Solana performance narrative. The dominant DeFi analytical framework is shifting away from TVL as the primary success metric toward capital efficiency and revenue density. Babylon's BTCFi protocol holds USD 5.64 billion in TVL representing 56,853 BTC, after receiving a16z investment in January 2026, while its BABY token rebounded 90% from historical lows and gained 30% in the past seven days.
What to Watch
- BTC dominance needs to fall below 59.63% while the Altcoin Season Index rises above 50 to confirm broad altseason — as of this week both metrics are moving further from those thresholds, with dominance at 60.88% and ASI at 35
- Hyperliquid's prediction market launched May 5 with USD 6 million in day-one volume; tracking weekly volume growth versus Polymarket and Kalshi over the next 30 days will indicate whether HYPE can sustain its current multi-narrative premium
- Plasma (XPL) and Circle Arc carry institutional backing from Tether and Circle respectively; total stablecoin settlement volume and developer adoption metrics will be the key indicators as the Stablechain sector establishes baseline comparables
- The Canary Capital PEPE spot ETF S-1 filed April 8 is pending SEC review; its outcome will set precedent for whether meme coin assets can access the same ETF distribution infrastructure that drove USD 2.44 billion into Bitcoin ETFs in April 2026
Ready to start trading?
Trade on Bitget Try CoinTech2uAffiliate links — we may earn a commission at no extra cost to you.
Frequently Asked Questions
What caused Bitcoin ETFs to post USD 1 billion in outflows the week of May 11-15, 2026?
Three factors converged: investors taking profits after six consecutive weeks of inflows totaling roughly USD 2.44 billion in April, US inflation data coming in above expectations, and Federal Reserve commentary that reduced risk appetite. ETF demand, Coinbase spot buying, and South Korean retail demand all weakened simultaneously that week, amplifying the net outflow figure.
What is a Stablechain and which projects are currently building them?
A Stablechain is an L1 blockchain where a stablecoin such as USDT or USDC serves as the gas token and native unit of account, removing the need for a separate volatile token to pay transaction fees. The four main projects as of May 2026 are Plasma (XPL), with Tether issuing USDT natively on-chain and checkpoints written to Bitcoin; Circle Arc, backed by Circle; Tempo; and Stable, which uses USDT as gas with no separate L1 token at all.
Does BTC dominance at 60.88% mean an altcoin season is near or far?
Market analysts define altseason as requiring BTC dominance to fall below 59.63% while the Altcoin Season Index rises above 50. As of this week, dominance has moved further above that threshold to 60.88% and the index has dropped to 35 from 39 the prior period. Both conditions are moving in the opposite direction from altseason triggers, meaning broad altcoin rotation is currently further away than it was a week ago.


