Bitcoin $1B Long Liquidations in May 2026: Funding Rates and OI Collapse Explained
BTC fell to $78K on May 16 2026 as long liquidations hit $1B over 48 hours. We break down funding rates, OI data, and macro triggers.
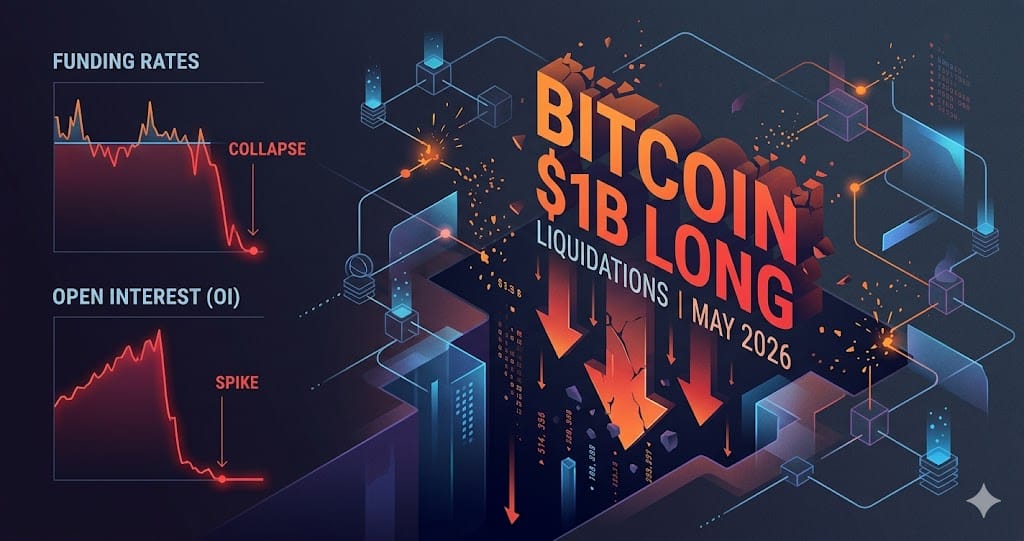
Between May 15 and May 16, 2026, Bitcoin long positions were liquidated for approximately USD 1 billion over 48 hours, with BTC sliding to USD 78,000 on May 16 and triggering USD 500 million in additional long liquidations in that single day alone. The event followed 67 consecutive days of negative BTC perpetual funding rates from early March to early May, breaking the previous record of 62 days set during the March 2020 COVID crash, according to K33 Research.
The cascade was not driven by crypto-native factors alone. US 10-year Treasury yields rose to 4.58%, UK gilts hit 5.2%, and the Nasdaq recorded its worst session since March 2026 on the same day, confirming that Bitcoin now trades as a fully synchronized risk asset. Meanwhile, a structural shift is underway: for the first time, BTC options open interest has surpassed futures open interest, a change that may reduce the severity of future liquidation events.
The 48-Hour Liquidation Cascade: Scale and Cross-Exchange Distribution
Gate.io recorded USD 131.75 million in BTC long liquidations against USD 35.49 million in short liquidations on May 15, a long-to-short ratio of 3.7-to-1. That single-exchange figure represents roughly 24% of the USD 552 million CoinGlass reported for the full market on the same day, indicating the cascade was distributed simultaneously across Binance, OKX, Bybit, and Gate rather than concentrated on one venue.
Adding CoinDesk's figure of USD 500 million in long liquidations for May 16 as a pure daily increment to the USD 552 million CoinGlass total for May 15 puts the 48-hour window at approximately USD 1 billion in long-side liquidations. That exceeds the USD 410 million all-market total recorded on May 11, making the May 15-16 event the largest single-direction cascade since at least March 2026.
Open Interest Collapse: Coin-Denominated and Dollar-Denominated Evidence
Bitcoin futures open interest dropped from 381,000 BTC to 314,000 BTC over the quarter, a coin-denominated decline of 17.5% that strips out price effects. In US dollar terms, the fall was from USD 112 billion on May 10 to USD 59.58 billion by May 13, a 47% decline. The roughly 30-percentage-point gap between the two measures corresponds closely to BTC's own price drop from around USD 104,000 to USD 80,000, a decline of approximately 23%.
Both measures point to the same conclusion: the May deleveraging was a genuine position flush, not a statistical artifact of falling prices making dollar-denominated OI look smaller. Three consecutive months of quarter-over-quarter open interest unwind confirm that the May 10 USD 112 billion figure likely marked the peak of leveraged positioning for this cycle.
67 Days of Negative Funding: The Structural Setup Behind the Crash
K33 Research documented 67 consecutive days of negative BTC perpetual funding rates from early March through early May 2026, breaking the previous 62-day record set during the March 2020 crash. A separate Phemex analysis cited 46 consecutive days as of April 15, reflecting an earlier measurement window. By April 16, the 7-day funding rate average reached negative 0.005%, the most negative reading since 2023, according to CoinDesk.
Over 201 eight-hour settlement periods, a USD 10,000 short perpetual position accumulated approximately USD 201 in funding payments at a conservative average rate of 0.01% per period, equating to roughly 2.4% annualized. The sustained negative environment created a compressed setup: short holders were being penalized daily while BTC climbed from around USD 60,000 to USD 75,000, producing the three-stage short-squeeze cascade between May 8 and May 13. The May 15-16 long liquidation wave was the mirror rebalancing of that same positioning cycle.
Options Overtake Futures and What It Signals for Future Cascades
BTC options open interest has surpassed futures open interest for the first time, according to data cited by CryptoBreaking and TradingView. Because options buyers have a capped downside and are not subject to margin calls, this shift reduces the forced-selling feedback loop that amplifies futures-driven liquidation cascades. The altcoin funding rate picture supports a partial normalization: SOL stands at negative 0.0036%, ETH at negative 0.0038%, XRP at negative 0.0025%, and DOGE has flipped positive to 0.0044%. Polkadot remains the outlier at negative 0.0472%, the deepest among majors and the only asset that has not yet mean-reverted.
BTC dominance rose to 60% during the cascade and the altcoin season index sits at 39, reflecting continued capital concentration in Bitcoin. Hyperliquid charges annualized funding rates roughly double those on Binance for equivalent perpetual pairs, a structural gap that cross-exchange funding arbitrage strategies have exploited at 5.98% to 11.4% fixed annualized rates in 2026, with peaks exceeding 23% during high-volatility periods. Whether the options-dominant structure holds through the next macro shock will determine whether USD 1 billion 48-hour liquidation events remain possible or become structural outliers.
What to Watch
- Polkadot perpetual funding rate at negative 0.0472% is the only major that has not mean-reverted; a squeeze remains possible if BTC dominance pulls back from 60%
- US 10-year Treasury yields at 4.58% and UK gilt yields at 5.2% are the macro variables most tightly correlated with the May 15-16 crypto sell-off; any further bond market deterioration could retrigger the same synchronized liquidation pattern
- BTC options open interest has just crossed above futures OI for the first time; if this lead widens, the structural capacity for futures-driven cascade events will continue to decline over the medium term
- Coin-denominated BTC futures OI sits at 314,000 BTC after the quarter-long unwind from 381,000 BTC; a rebuilding of that figure toward prior highs would signal re-leveraging and renewed cascade risk
Ready to start trading?
Trade on Bitget Try CoinTech2uAffiliate links — we may earn a commission at no extra cost to you.
Related Articles
- BTC Crashes to USD 78,600: The May 2026 Liquidation Cascade Explained
- Crypto Market Week in Review: TON, Clarity Act, and Altseason 2026
- Bitcoin Liquidation Cascade May 2026: What the Data Reveals
Frequently Asked Questions
What caused the Bitcoin liquidation cascade on May 15 and 16, 2026?
Two factors converged. First, 67 consecutive days of negative perpetual funding rates had accumulated a large pool of short positions that were gradually squeezed out between May 8 and May 13, leaving a concentrated pool of recently-opened long positions vulnerable to a reversal. Second, on May 15, US 10-year Treasury yields reached 4.58%, UK gilts hit 5.2%, and the Nasdaq posted its worst session since March 2026, triggering broad risk-off selling across equities, bonds, gold, and crypto simultaneously. The combination produced roughly USD 1 billion in long liquidations across 48 hours.
How large was the drop in Bitcoin open interest and what does it mean?
Coin-denominated BTC futures open interest fell from 381,000 BTC to 314,000 BTC during the quarter, a decline of 17.5% after stripping out price effects. In dollar terms, the drop was from USD 112 billion on May 10 to USD 59.58 billion by May 13, a 47% fall. The roughly 30-percentage-point gap between the two measurements corresponds to Bitcoin's own price decline from around USD 104,000 to USD 80,000. Because real coin-denominated positions fell by 17.5%, the deleveraging reflects genuine position closure rather than a statistical artifact of lower prices inflating the percentage drop.
Does BTC options open interest exceeding futures open interest change the risk of future crashes?
It reduces one specific amplification mechanism. Futures positions trigger margin calls and forced market-sell orders when prices fall, creating a feedback loop that drives prices lower and forces additional liquidations. Options buyers cannot be margin-called in the same way, so a market where options dominate total open interest is structurally less prone to cascade-style liquidations. That said, the macro correlation observed on May 15-16, where crypto moved in lockstep with US Treasuries, the Nasdaq, and UK gilts, represents a separate and independent risk driver that a shift toward options dominance does not eliminate.


