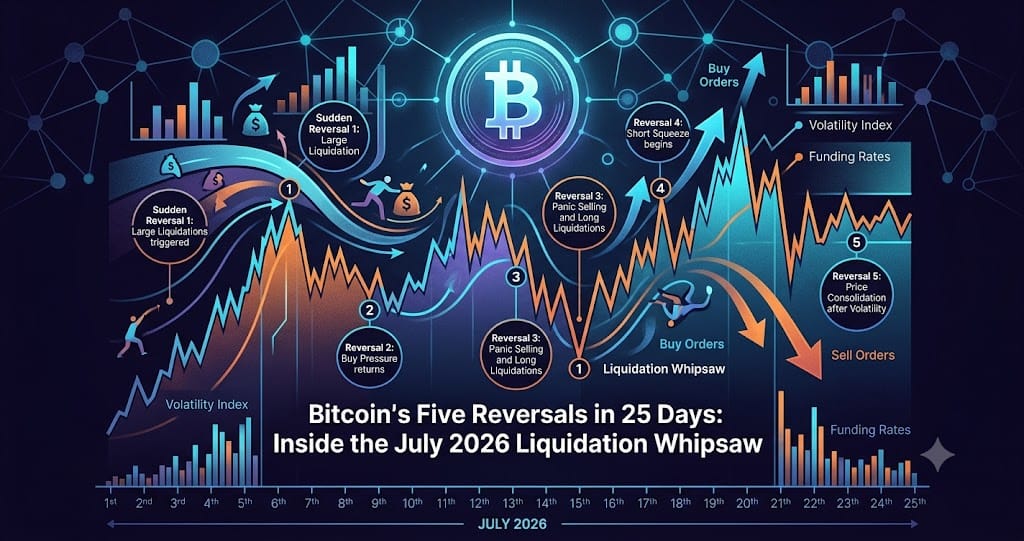
Bitcoin's Five Reversals in 25 Days: Inside the July 2026 Liquidation Whipsaw
BTC fell to $61,691 on July 8, 2026 after Trump called the Iran ceasefire over, triggering $500M in liquidations after a 25-day, five-reversal cycle.
Bitcoin dropped more than 3% to roughly $61,691 on July 8, 2026 after President Trump declared the Iran ceasefire "over" and called negotiations with Tehran "a waste of time," triggering an estimated $450 million to $500 million in crypto liquidations within 24 hours, according to CoinDesk and Bloomberg. Roughly $350 million of that came from altcoin pairs including JUP, ETHFI, and PUMP, which fell between 5.5% and 9.3%, while BTC itself accounted for about $100 million and ETH about $90 million.
The event closed out a 25-day cycle in which crypto sentiment reversed direction five separate times, each flip triggered by a different macro catalyst: a US-Iran peace signal on June 14, a dovish Bank of Japan decision on June 16, a hawkish dot plot from Fed official Kevin Warsh on June 17, a weak nonfarm payrolls report paired with ETF inflows on July 2, and finally the ceasefire collapse on July 8. This piece breaks down the liquidation mechanics behind each swing, the funding-rate dynamics that set up the squeezes, and the price levels still loaded with liquidation risk.
July 8: The Ceasefire Collapse That Ended the Squeeze
The US military reportedly struck Iranian Revolutionary Guard Corps vessels in the Strait of Hormuz, and Iran responded with strikes on Bahrain and Kuwait, according to reporting cited by Benzinga. Trump's subsequent statement that the ceasefire was over sent BTC below $62,000 and ETH down more than 2%, with Solana erasing its entire July gain and the CoinDesk 20 index falling 2.9%.
The liquidation pattern marked a sharp reversal from just 24 hours earlier: on July 7, BTC had dipped to $62,800 before $108 million in short liquidations pushed it back up to $64,000, according to cryptonews.net. The switch from short-side pain on July 7 to long-side pain on July 8 shows how quickly the second squeeze cycle that began on July 2 lost momentum once the geopolitical trigger reversed.
Mapping the Liquidation Battlefield
Before the July 8 selloff, Coinglass data showed a near-symmetric standoff: a breakout above $67,041 was set to liquidate $625.85 million in short positions, while a breakdown below $64,074 threatened $652.86 million in longs, according to CryptoRank. The heatmap identified $64,500 to $66,000 as a dense short-liquidation pool and $61,000 to $61,500 as a long-liquidation cluster, per crypto.news.
Bitget separately flagged $680 million in long liquidation risk below $60,711, a level referenced in its own analysis at Bitget. The July 8 drop landed directly on the long side of this ammunition map, and the $60,711 level remains an active liquidation target if geopolitical tensions escalate further.
The June Breakdown Below $60,000
On June 24 and 25, BTC fell nearly 5% to an intraday low near $59,600 (reported as low as $59,800), with total liquidations exceeding $650 million and longs absorbing $580 million of that figure against just $70 million in shorts, an 8.3-to-1 ratio, according to Cryptobriefing. The same two-day window saw roughly $180 million in spot BTC ETF net outflows and $152.5 million in ETH ETF outflows.
A separate report from CryptoDaily puts the June 25 single-day liquidation total at $1.48 billion across more than 217,000 traders, more than double the $706 million figure recorded for June 24 alone. Open interest bottomed on June 28 at $44.09 billion, a 5.66% drop, before recovering to roughly $46.35 billion by July 7-8, still below the cycle peak.
The 46-Day Funding Drain Behind the Squeeze
The setup for 2026's repeated short squeezes traces back to a 46-day stretch of negative BTC perpetual funding rates from mid-February to April 15, the longest such run since the post-FTX period in November 2022, according to CoinDesk and KuCoin. An analysis from crypto.news estimated that at 20x leverage, a 0.05% funding rate settling three times daily erodes roughly 1% of a short position's available margin per settlement, compounding over the 46-day span.
By the time Strategy's purchase of 34,164 BTC (worth about $2.54 billion) hit the market in late April, short-side margin had reportedly been depleted by 30% to 40%, setting off more than $427 million in short liquidations and pushing BTC to $77,500. Historical parallels cited in the same analysis include a 50-day negative funding stretch in 2022 that preceded a rally from $15,500 to $23,000 (a 48% gain), and a roughly 45-day stretch in 2021 that preceded a move from $29,000 to $48,000. June's spot BTC ETF flows told a different story, with net outflows totaling $4.5 billion for the month, the worst monthly figure since spot BTC ETFs launched.
What to Watch
- The $60,711 level flagged by Bitget, where a breakdown would put roughly $680 million in long positions at liquidation risk
- The $64,074 to $67,041 range, the near-symmetric zone Coinglass identified as holding $652.86 million in longs and $625.85 million in shorts before the July 8 selloff
- Further US-Iran developments, given that the same geopolitical axis has now triggered squeezes and reversals on June 14 and July 8
- Monthly spot BTC and ETH ETF flow data, after June's $4.5 billion net outflow marked the worst month since the products launched
Ready to start trading?
Trade on Bitget Try CoinTech2uAffiliate links — we may earn a commission at no extra cost to you.
Related Articles
- Bitcoin Short Squeeze 2026: Inside the $498M Liquidation Event and the $65K-$68K Corridor Ahead
- Bitcoin's June-July 2026 Whipsaw: $4.56B in Liquidations, Then a Short Squeeze
- Crypto Narratives Survive Risk-Off As Bitcoin Falls Below $60K in 2026
Frequently Asked Questions
What caused the Bitcoin price drop on July 8, 2026?
President Trump declared the Iran ceasefire "over" following reported US strikes on Iranian Revolutionary Guard Corps vessels in the Strait of Hormuz and Iranian retaliatory strikes on Bahrain and Kuwait. BTC fell more than 3% to about $61,691, triggering an estimated $450 million to $500 million in liquidations across the crypto market, with roughly $350 million coming from altcoins like JUP, ETHFI, and PUMP.
How many times did crypto sentiment reverse in the lead-up to July 8?
Five times in 25 days. The sequence ran from a US-Iran peace signal on June 14 that sparked a short squeeze, to a dovish Bank of Japan decision on June 16, a hawkish Fed dot plot from Kevin Warsh on June 17 that turned sentiment bearish, weak nonfarm payrolls data plus ETF inflows on July 2 that sparked another squeeze, and finally the ceasefire collapse on July 8 that reversed the market again.
What triggered the short squeeze that pushed Bitcoin to $77,500 in late April 2026?
A 46-day stretch of negative perpetual funding rates from mid-February to April 15, 2026, the longest since November 2022, steadily eroded short sellers' margin through compounding settlement costs. When Strategy purchased 34,164 BTC worth about $2.54 billion in late April, it triggered over $427 million in short liquidations, pushing BTC up to $77,500.