Bitcoin's June-July 2026 Whipsaw: $4.56B in Liquidations, Then a Short Squeeze
Bitcoin liquidations hit $4.56B in June 2026, the Fear and Greed Index fell to 15, then a short squeeze pushed BTC back above $63,900 by July 6.
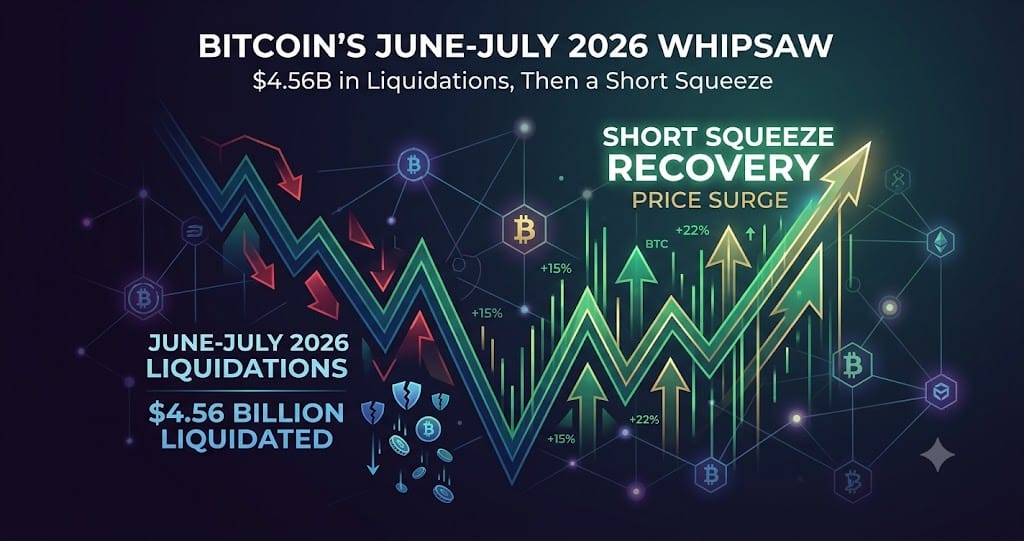
Bitcoin liquidations totaled $4.56 billion over the 30 days through late June 2026, with a single-day peak of $402 million on June 4, before a short squeeze in early July pushed BTC from a low near $58,000-$60,000 back above $63,900. The market cycled through four distinct liquidation regimes in about six weeks: a long-heavy flush on June 24 that wiped out $706 million in 24 hours (84% longs), a bottom near $58,000 on July 1, and a short-heavy squeeze from July 2 through July 6 that liquidated an estimated $450-500 million in bearish bets.
The trigger chain shifted three separate times. Middle East de-escalation drove sentiment on June 14, a hawkish Bank of Japan rate move weighed on risk assets on June 16, and a weak U.S. jobs report on July 2 showing only 57,000 nonfarm payroll additions killed rate-hike bets and sparked the reversal. In each case, crowded positioning on one side of the market, not the headline itself, determined how violent the move became.
The June Cascade: $4.56 Billion in Liquidations Over 30 Days
Fed official Kevin Warsh's hawkish tone on June 17 set off a decline that fully materialized as forced selling by June 24, when 24-hour liquidations hit $706 million with longs accounting for 84% of that total, according to CoinStats. BTC fell to $62,729 that day, down 1.92% on the day and 4.47% on the week, as a global tech stock selloff compounded the hawkish Fed repricing.
That single day sat inside a rolling 30-day total of $4.56 billion in liquidations, the largest monthly figure of 2026 by that measure. The biggest single day was June 4, when BTC dropped from $64,100 to $61,600 and triggered roughly $451 million in forced closures, a $402 million print by CoinStats' count. For comparison, the June 16 short squeeze liquidated $536 million and June 2 still holds the year's single-day record at $1.8 billion, per Bitcoin Foundation.
The Short Squeeze: How $1.84 Billion in Bearish Bets Fueled the July Rally
As BTC fell through late June, traders rebuilt short positions rather than staying cautious. By late June, open interest data showed roughly $1.84 billion in short positions stacked below $66,400, against only $331 million in longs at risk — a 5.6-to-1 imbalance that became the fuel for the next squeeze, according to CoinStats.
The June nonfarm payrolls report on July 2 showed just 57,000 jobs added, far below expectations, and killed near-term rate-hike odds. BTC broke through the $62,000 resistance level it had sat under for weeks, triggering over $100 million in short liquidations that day alone. By July 4, 24-hour liquidations reached $175 million with shorts making up 87.8% of BTC liquidations, 83.0% of ETH, and 90.4% of SOL, per Bitcoin World. A brief cooling day followed on July 5 with liquidations of only $31 million as BTC held above $62,000, per news.Bitcoin.com, before BTC touched $63,900 in the early hours of July 6, capping a weekend in which short liquidations totaled roughly $450 million by Coinglass figures.
Sentiment Whiplash: From a 53% Drawdown to a Fractured Fear and Greed Reading
Around July 1, BTC traded in the $58,000-$60,000 range, breaking below every key moving average — the 20-day EMA near $62,450, the 200-day MA near $65,200, and the 50-month MA near $65,600 — with RSI approaching the oversold threshold of 30, according to crypto.news. That put BTC roughly 53% below its October 2025 all-time high of $126,198.
The Fear and Greed Index sat in the 12-16 range from July 1 through July 6, with Alternative.me reporting 15 as of July 6, not far from the all-time low of 5 recorded on February 6. But sentiment gauges diverged sharply on the same day: Alternative.me showed 15 (extreme fear), Milk Road showed 53 (neutral), CFGI showed 36 (fear), and FearGreedMeter showed 23 (extreme fear) — a roughly 40-point spread that suggests momentum-based indicators had already stabilized while survey-based sentiment remained near a floor.
Open Interest Cleanout and the ETF Flow Reversal
Bitcoin futures open interest collapsed from a peak above $90 billion to roughly $44.5 billion, with CoinGlass putting the June 24 reading at $45.47 billion (a weekly range of $44.44-48.35 billion, down 1.05% on the week). Funding stayed mildly positive at +0.0022% per 8 hours, an annualized rate of about 2.44%, indicating the prior long crowding had been fully washed out rather than just trimmed.
Spot Bitcoin ETFs recorded a net outflow of $4.5 billion in June, the worst single month since launch, including a $696 million single-day outflow on June 26 and $1.79 billion pulled out in the week of June 29. That reversed sharply in early July: the rebound came alongside a $221 million net ETF inflow, suggesting institutional money moved from withdrawing support during the selloff to reinforcing the squeeze on the way back up. Some analysts point to a cycle model suggesting a bottom isn't due until mid-October, competing with the narrative that extreme fear readings mark the low.
What to Watch
- Whether funding rates turn negative again, which has preceded each of the last three short squeezes in June and July 2026
- The direction of spot Bitcoin ETF flows after June's record $4.5 billion outflow and July's $221 million inflow
- Divergence between sentiment gauges — Alternative.me at 15 versus Milk Road at 53 on July 6 — as a sign of which indicator is leading
- Open interest holding near the $44-45 billion floor versus rebuilding toward the prior $90 billion peak
Ready to start trading?
Trade on Bitget Try CoinTech2uAffiliate links — we may earn a commission at no extra cost to you.
Related Articles
- Crypto Narratives Survive Risk-Off As Bitcoin Falls Below $60K in 2026
- Bitcoin's Third Regime Flip in Two Weeks: FOMC June 2026 Breakdown
- Bitcoin Fear & Greed Hit 8 in June 2026: What the Data Reveals
Frequently Asked Questions
What caused the June 2026 Bitcoin liquidation cascade?
A hawkish shift from Fed official Kevin Warsh on June 17 drove a decline that fully materialized as forced selling by June 24, when 24-hour liquidations hit $706 million with longs making up 84% of that total and BTC falling to $62,729. The move followed a broader 30-day liquidation total of $4.56 billion, the largest monthly figure of 2026.
Why did Bitcoin short sellers get liquidated in early July 2026?
Traders had built up roughly $1.84 billion in short positions below $66,400 against only $331 million in longs, a 5.6-to-1 imbalance. A weak U.S. jobs report on July 2 showing just 57,000 nonfarm payroll additions killed rate-hike expectations, BTC broke above $62,000 resistance, and an estimated $450-500 million in short positions were liquidated across the following days.
Is a Fear and Greed Index reading of 15 historically a bottom signal for Bitcoin?
Extreme fear readings have often clustered near local bottoms historically, and BTC did rebound from a 53% drawdown low near $58,000-$60,000 shortly after the index fell to 12-16 in early July 2026. But sentiment gauges diverged sharply on the same day, with Milk Road showing a neutral 53 versus Alternative.me's 15, and one cycle-based model points to a bottom as late as mid-October, so the signal isn't unanimous across methodologies.