Bitcoin Falls Below USD 73,000 in Third Cascade Wave — May 2026
Bitcoin fell below USD 73,000 on May 27-28, 2026, as USD 958.8M was liquidated across 167,706 accounts. Here is what triggered the third cascade wave.
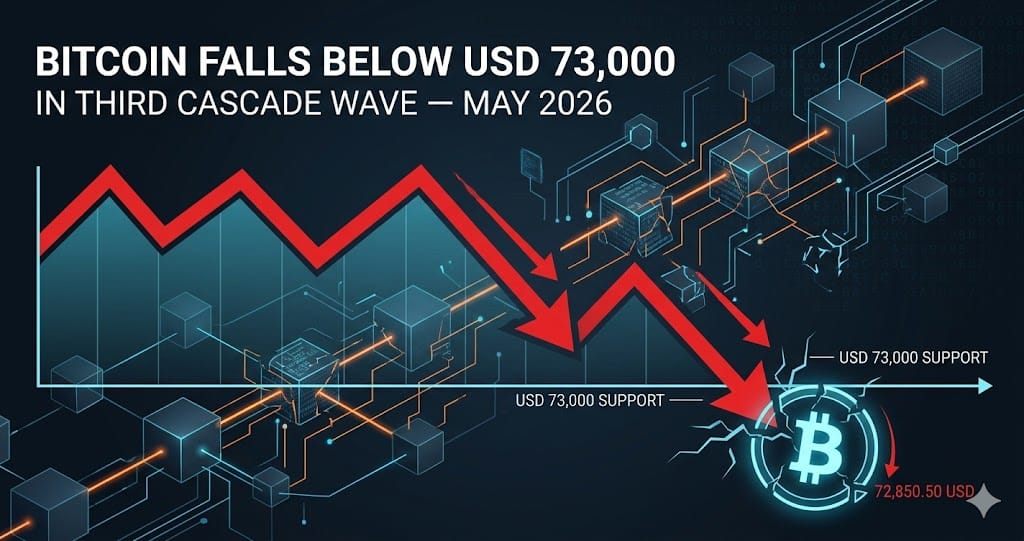
Bitcoin fell below USD 73,000 on May 27-28, 2026, making this the single largest liquidation event in a three-wave cascade that began on May 13. In under 24 hours, USD 958.8M was forcibly closed across 167,706 trader accounts, with long positions accounting for USD 897M — a 93% long-to-short ratio that surpassed the USD 941M event of May 22-23 and set a new peak for the entire cascade chain.
Three independent shocks converged to produce that result: a second round of US CENTCOM airstrikes on Iranian military targets near the Strait of Hormuz paired with the downing of four Iranian one-way attack drones, the approaching May 29 Deribit options expiry carrying USD 6.25B in BTC open interest with max pain at USD 75,000, and the rapid collapse of a brief funding rate reversal that had lured late buyers into the market just hours before the drop.
The Third Cascade Wave: What Happened on May 27-28
The May 27-28 event was the third and most destructive leg of a sequence that started with hot PPI data on May 13. Bitcoin had already been pushed to USD 76,270 in the first wave and USD 74,255 in the second before staging a short-lived recovery above USD 80,000 on May 25. When US forces conducted a second airstrike near Hormuz and shot down four Iranian drones targeting commercial ships, BTC broke through USD 73,000 within hours, extending the cascade chain's cumulative week-over-week decline to approximately 6.3%.
CoinGlass data puts the full scope in precise terms: USD 958.8M in total liquidations, 167,706 accounts hit, and the largest single order being a USD 15.34M BTC position on Hyperliquid. That figure is 52% smaller than the USD 32.4M Bigget liquidation from May 22, which signals a structural shift — the largest over-leveraged positions have been systematically flushed across three cascade legs, and the remaining high-conviction shorts are operating at reduced scale. The liquidation epicenter also shifted exchanges, moving from Bigget in May 22 to Hyperliquid in May 28.
The Funding Rate Trap: 84 Days of Negative Rates, Then a False Signal
On May 27, Bitcoin perpetual funding rates flipped positive for the first time after an 84-consecutive-day negative streak — the longest such run recorded in the 2020s, according to K33 Research data cited by FXStreet. Under normal conditions, a funding rate flip from negative to positive signals short covering and potential upside momentum. Late long positions entered the market on the back of that signal, with exchange stablecoin reserves and open interest rising in tandem, confirming fresh capital rather than internal repositioning.
The reversal lasted less than 24 hours. The second US military action hit during that window, collapsing the nascent long momentum and converting new buyers into trapped positions. This sequence — crowded shorts getting squeezed, funding turning positive, late longs absorbing their exit, then a macro shock flushing those longs — represents a textbook two-phase liquidation dynamic. A counter-narrative from 10x Research adds an important caveat: much of the 84-day negative funding likely reflected hedge fund structural hedging of existing long equity or spot positions, not pure directional bearish bets, which means the signal quality of funding rate flips as a sentiment indicator is meaningfully lower than in prior cycles.
The USD 15B Options and Futures Overhang Into May 29
The May 29 Deribit expiry carries USD 6.25B in BTC options open interest, with max pain pinned at USD 75,000 and a heavy concentration of call positions stacked between USD 80,000 and USD 82,000. Bitcoin entered the expiry window already trading below USD 73,000 — roughly USD 2,000 below max pain. When spot trades below max pain, dealers who sold those calls mechanically reduce their delta hedges by selling spot or futures, creating selling pressure that reinforces the existing downtrend rather than providing natural support.
Combined with CME standard BTC futures open interest of approximately 23,000 contracts representing 115,000 BTC as of May 19, total Deribit and CME combined leverage exposure heading into month-end sits around USD 15B. The May 27-28 cascade consumed roughly USD 1B of that. The remaining approximately USD 14B in open positions still needs to clear before the leverage overhang is resolved. The Crypto Fear and Greed Index reading of 25 — just above the extreme fear threshold of 20 — suggests the market has not yet reached the capitulation depth that would typically precede a durable floor.
Sentiment Readings: Polymarket, Altcoin Index, and Smart Money Behavior
Polymarket's daily market for May 27 priced a 99% probability of Bitcoin closing lower, reflecting near-complete short-term bearish consensus. On a longer horizon, 79% of Polymarket participants expect MicroStrategy to sell Bitcoin by December 31, 2026, with a separate 42% probability assigned to a sale by June 30. Only 4.5% assigned meaningful probability to a forced margin call — the crowd is pricing discretionary selling driven by eroding conviction, not a leverage-forced liquidation of MSTR holdings.
The Altcoin Season Index reading of 35 and Bitcoin dominance at approximately 60.3% confirm a structural shift into a Bitcoin-only defensive regime that predates the May cascade events, having declined steadily from a peak of 78 in September 2025. Meanwhile, new smart money positioning on Hyperliquid shows USD 7.4M in BTC shorts and USD 8.7M in ETH shorts entered at 20x leverage after the May 27-28 wave. A 5% adverse move would liquidate these positions, making the USD 73,000 to USD 77,000 zone a critical friction band for any near-term recovery attempt and a potential short-squeeze trigger if BTC rallies unexpectedly.
What to Watch
- May 29 Deribit expiry with USD 6.25B in BTC open interest and max pain at USD 75,000 — watch for options dealer delta unwind selling if BTC remains below that level at settlement
- Fear and Greed Index proximity to the extreme fear threshold of 20: the current reading of 25 is near but not below the level historically associated with capitulation lows, suggesting the bottom may not yet be established
- Hyperliquid 20x short positions totaling USD 16.1M in BTC and ETH: these positions liquidate on a 5% upside move, meaning a recovery toward USD 76,500 to USD 77,000 could spark a short squeeze among this cohort of medium-sized accounts
- Polymarket MicroStrategy sell probability at 42% by June 30: any on-chain movement from MSTR wallets or public statements about holdings could rapidly re-price this market and amplify spot selling pressure across the remainder of the month
Ready to start trading?
Trade on Bitget Try CoinTech2uAffiliate links — we may earn a commission at no extra cost to you.
Related Articles
- Crypto Whale Wipeouts and Sentiment Collapse: May 2026 Cascade Analysis
- Bitcoin's May 2026 Three-Wave Cascade: Geopolitics, Leverage, and USD 1.47B Fund Exodus
- Bitcoin's USD 941M Liquidation Cascade: What the May 2026 Crash Reveals
Frequently Asked Questions
Why did Bitcoin fall below USD 73,000 on May 27-28, 2026?
Three factors converged simultaneously: a second round of US CENTCOM airstrikes near the Strait of Hormuz paired with the downing of four Iranian drones targeting commercial ships, the approaching Deribit options expiry on May 29 with USD 6.25B in open interest and max pain at USD 75,000, and the collapse of a brief funding rate reversal that had turned positive after an 84-day negative streak, trapping late long buyers who entered on the signal within hours of the geopolitical shock.
What does the 84-day negative funding rate streak tell us about market structure in 2026?
An 84-consecutive-day negative funding rate means shorts were paying longs to hold positions for nearly three months — the longest such streak recorded in the 2020s according to K33 Research. While this is typically read as extreme bearish positioning, 10x Research notes that a significant portion likely reflected hedge funds using short perpetuals to hedge long spot or equity exposures, not pure directional bets. This structural hedging use case dilutes the reliability of funding rate flips as a clean crowd-sentiment signal in the current cycle.
Is Bitcoin near a capitulation bottom after three cascade waves in May 2026?
The evidence is mixed. The Fear and Greed Index at 25 is near but not below the 20 threshold associated with capitulation bottoms, and the three cascade waves from May 13 through May 28 cleared the largest whale-scale positions — peak single-order size dropped from USD 32.4M on May 22 to USD 15.34M on May 28. However, roughly USD 14B in combined Deribit and CME open interest remains unresolved heading into the May 29 expiry, and new 20x leveraged shorts totaling USD 16.1M have already re-entered on Hyperliquid, keeping the probability of a fourth cascade wave meaningfully elevated.