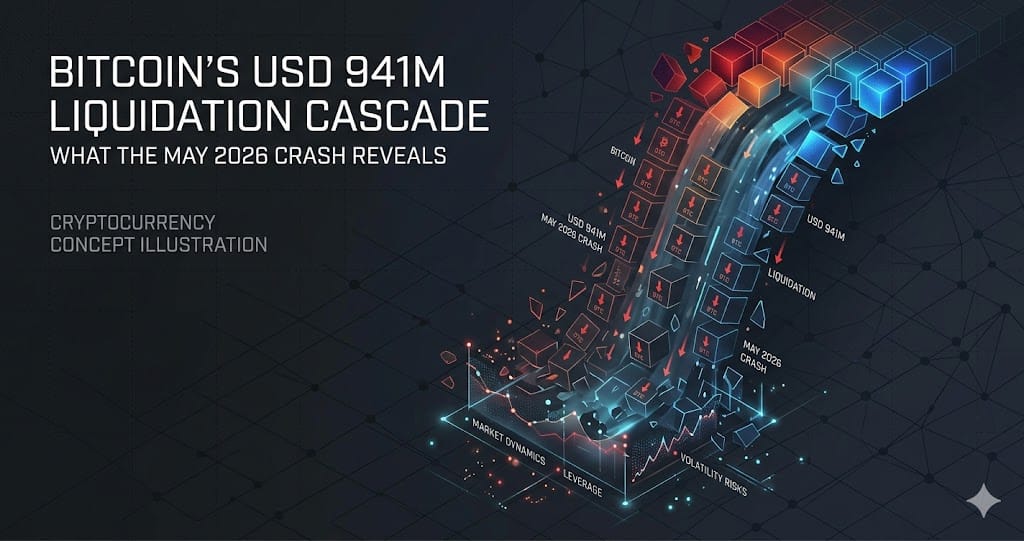
Bitcoin's USD 941M Liquidation Cascade: What the May 2026 Crash Reveals
BTC crashed to USD 74,255 on May 22-23 2026, triggering USD 941M in liquidations across 161,200 accounts. Here is what drove the cascade and what
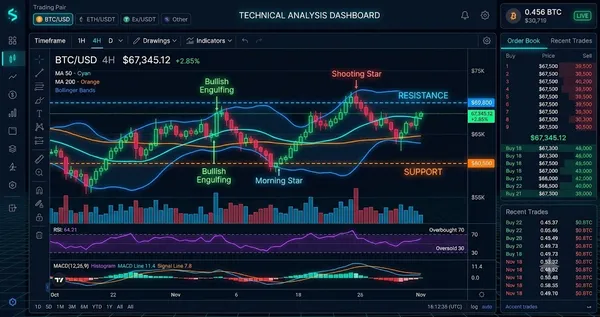
Bitcoin's May 2026 selloff is now confirmed as a two-wave event. On May 22-23, BTC flash-crashed from above USD 77,000 to USD 74,255, triggering USD 941M in 24-hour liquidations across 161,200 trader accounts — a 43% larger single-event than the May 19 figure of USD 657M that preceded it. Long positions absorbed 92.4% of the damage: USD 870M in longs were cleared against only USD 71.4M in shorts.
The episode was not a simple price shock. It was the convergence of three distinct trigger categories: a macro inflation impulse from the May 13 PPI print, 67 consecutive days of negative perpetual funding rates compressing since mid-April, and a geopolitical risk-off event when US-Iran nuclear negotiations collapsed on May 22. Each layer reinforced the others, producing an outcome no single-variable model would have forecast.
The May 22-23 Second Cascade: Scale and Mechanics
The May 22-23 event was structurally distinct from the May 15-19 cascade. BTC fell from USD 77,000 to USD 74,255 within hours. Total 24-hour liquidations reached USD 941M, with BTC-specific liquidations at USD 378M and ETH at USD 255M per CoinGlass data. The long-to-short imbalance — USD 870M in longs versus USD 71.4M in shorts — established 92% long-dominated liquidations as a recurring structural feature of May 2026 cascades, not a one-time anomaly.
The single largest liquidation order came from Bigget exchange: a USD 32.4M BTC swap contract, exceeding any comparable single-order event on Binance or Bybit. ETH simultaneously fell to USD 2,065, a 5% single-day drop, while Polymarket priced 'ETH dip to USD 2,000 by May 24' at 71.2% YES. By May 24, BTC touched USD 74,000 and the Fear and Greed Index bottomed at 25 — Extreme Fear. The May 25 rebound to USD 76,565 brought the index back to 40, still in the Fear zone, with a notable divergence between recovering price and lagging sentiment.
Three Trigger Categories Behind the Crash
The May 2026 cascade chain now contains three distinct trigger types rather than the two initially identified. The first was the May 13 PPI macro shock, which ignited the initial May 15-19 liquidation wave. The second was mechanical cascade dynamics — leveraged long positions being sequentially cleared through the USD 76,270 support zone into the secondary defense band at USD 75,200-75,800. The third was geopolitical: the collapse of US-Iran nuclear negotiations on May 22 added a risk-off impulse that accelerated the second wave independently of on-chain positioning.
These trigger types are not equivalent. The PPI shock was a one-time scheduled data event. The leverage cascade was a mechanical consequence of over-leveraged positioning at identifiable price levels. The US-Iran variable was unforecastable from funding rate or open interest data. Any forward model relying only on derivatives metrics would have missed the May 22-23 catalyst, even with accurate technical setup awareness.
ETF Outflows, Funding Rates, and the Structural Setup
The cascade occurred against a backdrop of sustained institutional withdrawal. Bitcoin spot ETFs recorded net outflows exceeding USD 2B across two consecutive weeks, ending a six-week inflow streak. The week of May 11-15 saw USD 1.039B in outflows; the following week through May 22 contributed approximately USD 1B more. This sequence suggests institutional withdrawal was a pre-condition for the cascade rather than a co-trigger — spot demand had already thinned before leveraged longs were sequentially liquidated.
BTC perpetual funding rates had been negative for 67 consecutive days as of May 11, eclipsing both the prior 46-day reading from April 15 and the post-FTX 2022 streak. Over 201 consecutive 8-hour funding periods, long positions paid shorts continuously. However, 10x Research identified this negative funding as structural delta-neutral hedging by institutions — funds shorting perpetuals to offset spot exposure during redemption windows — rather than bearish directional conviction. This framing reduces the classic short-squeeze risk relative to 2022 conditions and complicates simple 'crowded short equals rebound fuel' narratives.
What Negative Funding History Suggests for Q3 2026
Six comparable deep-negative-funding regimes since 2018 all delivered positive returns at the 90-day mark, per CoinDesk and Brave New Coin data — a win rate of 83-96%. If the current streak originated around mid-April 2026, the 90-day mean-reversion window opens around mid-July 2026. This does not eliminate downside risk in the interim; the May 22-23 cascade demonstrated that structural signals and near-term catalysts can diverge sharply.
The Hyperliquid versus Binance funding cadence difference adds precision for active traders. Hyperliquid charges 0.01% per hour, while Binance applies 0.08% per 8 hours — mathematically similar, but Hyperliquid's hourly cadence means funding friction accumulates faster in absolute debit terms across a 67-day streak. A leveraged long position maintained on Hyperliquid through the full negative-funding period absorbed compounding costs well before price pressure arrived, amplifying the effective loss beyond raw price movement alone.
What to Watch
- BTC spot ETF weekly net flows: two consecutive weeks of approximately USD 1B outflows each indicate institutional demand has not recovered; a single week of net inflow above USD 500M would represent the first meaningful demand signal since early May.
- Fear and Greed Index: rebounded from 25 on May 24 to 40 on May 25; a sustained move above 50 would mark the first sentiment recovery above Neutral since before the May 13 PPI shock and could precede a positioning shift.
- BTC perpetual funding rates: the 67-day negative streak as of May 11 is the longest recorded since March-May 2020; watch for sustained positive funding as confirmation of organic demand rather than continued structural hedging by institutions.
- Polymarket 'BTC under USD 75,000 May' contract priced at 71% YES as of late May; any expiry above USD 75,000 would force rapid re-pricing of directional bets and likely trigger short covering across perpetual markets.
Ready to start trading?
Trade on Bitget Try CoinTech2uAffiliate links — we may earn a commission at no extra cost to you.
Related Articles
- 2026 Crypto Narratives: Equity Perps, AI Agents, and BTCFi Surge
- Bitcoin's May 2026 Cascade: How a PPI Shock Wiped USD 1.22 Billion in Two Days
- Bitcoin May 2026 Liquidation Cascade: USD 657M in One Day
Frequently Asked Questions
Why did 92% of liquidated positions in the May 2026 BTC crash belong to long traders?
The cascade hit while leveraged long positions were clustered in the USD 75,000-77,000 price range. When BTC broke below USD 76,270 on May 15-19 and again below USD 74,500 on May 22-23, automated liquidation engines cleared longs sequentially. Short positions held smaller total notional and were not concentrated at the key cascade price levels, producing the 92.4% long-dominated ratio: USD 870M in longs liquidated versus USD 71.4M in shorts across the May 22-23 event.
Does the 67-day negative funding rate streak mean traders expect BTC to fall further?
Not necessarily. 10x Research identified the negative funding as structural hedging rather than bearish conviction. Hedge funds were shorting perpetuals to neutralize spot exposure during fund redemption periods, not to express a directional view on price. This is categorically different from a crowded short built on bearish bets, and it reduces the classic short-squeeze risk that characterized the 2022 post-FTX environment, where negative funding reflected genuine bearish positioning rather than institutional risk management.
What is the significance of the USD 32.4M single liquidation on Bigget exchange?
The USD 32.4M BTC swap contract liquidated on Bigget was the largest single liquidation order recorded in the May 2026 cascade, exceeding any comparable single-order event on Binance or Bybit. It identifies Bigget as the primary mechanical epicenter of the May 22 cascade, not the better-known Tier-1 venues. This matters because concentration of large leveraged positions on smaller exchanges can amplify cascade dynamics beyond what aggregate open interest data on major platforms would predict, creating blind spots in standard liquidation heatmap models.