Bitcoin's 67-Day Funding Rate Flip and Liquidation Storm: May 2026 Analysis
Bitcoin's 67-day negative funding rate streak ended May 9-10 2026 as OI hit all-time highs and a $20.3M Hyperliquid short neared liquidation at
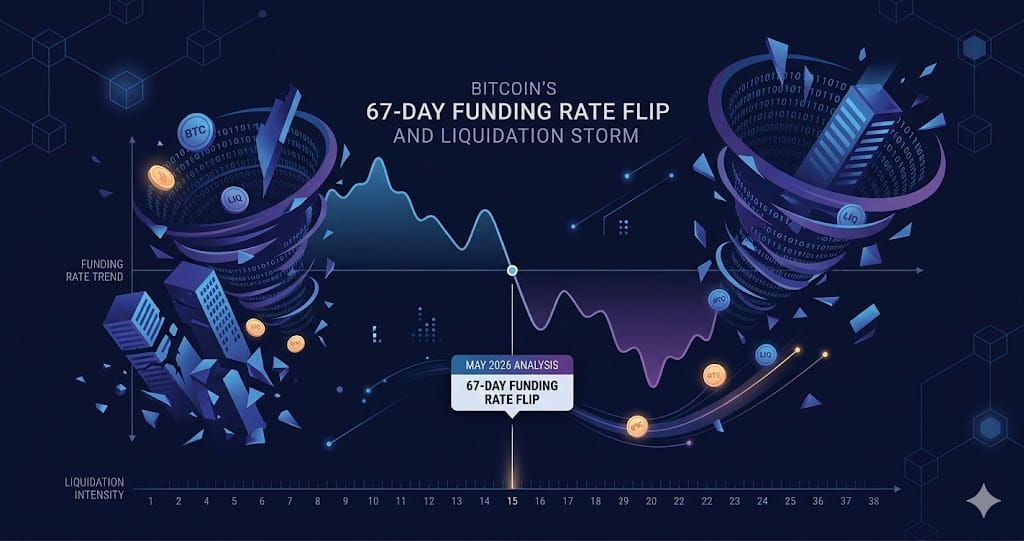
Bitcoin's 67-consecutive-day negative funding rate streak — the longest in at least 10 years — officially ended between May 9 and May 10, 2026, according to data from K33 Research and Bitfinex analysts. At the same time, BTC open interest surpassed every prior record including the November 2025 all-time high, while a single Hyperliquid whale carrying a USD 20.3 million 40x short position held the market's attention with a liquidation price pinned at USD 82,236.
The confluence of record leverage, a structural shift in funding sentiment, and large-scale stablecoin outflows from centralized exchanges creates a market environment where a cascade in either direction is plausible. BTC traded at USD 82,000 on May 11, 2026, up 2.13% in 24 hours, sitting just below a double resistance zone at USD 83,600 formed by the 200-day moving average and a long-term descending trendline.
The Hyperliquid Whale and the $82,236 Liquidation Map
On May 6, 2026, a wallet identified as 0x128e deposited 499,900 USDC on Hyperliquid and opened a 40x leveraged short on 250 BTC, creating a notional exposure of USD 20.32 million. With BTC trading near USD 81,000 at the time, only a 1.5% price increase was needed to trigger forced liquidation at USD 82,236. This was not an isolated incident: Hyperliquid recorded at least one other 40x BTC short in 2026 that resulted in a USD 3.7 million loss.
The USD 82,236 liquidation price functioned as a publicly visible target. Market participants with long exposure had a clear incentive to push price toward that level to trigger the forced unwind. BTC reached USD 82,320 on May 7, validating the mechanics of what researchers call a liquidation map — where whale positions visible on-chain directly influence short-term price objectives.
Record Open Interest and the Largest Single-Day OI Surge of 2026
CryptoQuant analyst Darkfost flagged on May 9-10 that the single-day increase in BTC open interest was the largest of 2026 and that the absolute OI level had surpassed every historical data point, including the peaks recorded during Bitcoin's November 2025 all-time high. Total BTC futures open interest across major exchanges was tracking near USD 61 billion, a figure previously cited for the combined BTC and ETH derivatives market.
The significance of this OI expansion depends on which framework you apply. Earlier analysis interpreted rising OI alongside negative funding rates as evidence of one-sided short accumulation. CryptoQuant's updated read is more nuanced: the combination reflects bidirectional structural accumulation, meaning both longs and shorts are adding leverage simultaneously with neither side dominating. Under this interpretation, the trigger event — a news headline, a geopolitical development, or a whale liquidation — determines the direction of the cascade rather than any pre-existing positional bias.
USDT Outflows, ETH Inflows, and the CEX Liquidity Drain
On May 8, 2026, USD 1.29 billion in USDT left centralized exchanges via the Ethereum network in a single day, the largest such outflow since February 2026, confirmed by MEXC News data. Rather than rotating into BTC spot positions on exchanges, institutional participants appear to have moved stablecoins into OTC venues, self-custody wallets, or DeFi protocols. The practical effect is a thinner CEX order book, where any directional move carries amplified slippage.
In contrast, large ETH deposits flowed into Binance across three consecutive days: 216,152 ETH on May 6, 98,552 ETH on May 8, and a USD 288 million equivalent on May 9. Exchange inflows of spot ETH are typically interpreted as a supply-side signal — holders positioning to sell. With ETH open interest simultaneously setting a record near 14.17 million contracts, the market faces a dual headwind of spot selling pressure and derivatives short accumulation. The internal divergence suggests ETH may face selling pressure before BTC does.
Funding Rate Regime Change: 67 Days of Shorts Unwinding
K33 Research documented that the 2026 negative funding rate streak reached 67 consecutive days before flipping, surpassing both the 46-day streak during the November 2022 FTX collapse and the approximately 62-day streak following the March 2020 COVID crash. In both prior cases the streak ended with a sharp short squeeze: BTC rose roughly 92% after the 2020 episode and approximately 55% after the 2022 one. The 2026 streak has so far produced a move from around USD 74,000 to USD 82,000, or about 10.8%, suggesting that if historical patterns hold, the squeeze may not yet be complete.
The funding rate structure as of May 10 is uneven across assets. BTC perpetuals on Binance showed a positive rate of approximately +0.0043%, signaling a shift toward net long demand. ETH perpetuals on the same exchange registered between -0.0020% and -0.0038% depending on the reporting window, while SOL sat at -0.0036% and XRP at -0.0025%. The divergence implies that short-squeeze pressure has migrated from BTC to major altcoins, where the funding cost is now being borne by short holders at an annualized rate exceeding 4% for ETH. If that pressure persists for three to four weeks, altcoin shorts face the same passive unwind dynamics that burned BTC shorts between April 15 and May 8.
What to Watch
- USD 83,600 double resistance: the 200-day moving average and long-term descending trendline converge here; a confirmed weekly close above this level would change the intermediate trend structure
- USD 82,236 residual liquidation zone: the Hyperliquid whale position was nearly triggered at this price; any reload of similar positions at USD 82,000-USD 82,500 recreates the same liquidation map dynamic
- USD 75,000 key support: Darkfost identifies this as the threshold below which a long-side cascade becomes self-reinforcing, with estimated downstream liquidation potential exceeding the USD 1.215 billion in shorts cleared between April 30 and May 7
- ETH and altcoin funding rates: ETH perpetual funding at -0.0038% on Binance as of May 10 is the leading indicator for the next altcoin short squeeze; watch for a flip toward zero or positive as the trigger signal
Ready to start trading?
Trade on Bitget Try CoinTech2uAffiliate links — we may earn a commission at no extra cost to you.
Related Articles
- Crypto Narrative Playbook: May 2026 Market Signals Decoded
- Bitcoin's 67-Day Negative Funding Rate Record and Short Squeeze Setup in May 2026
- Bitcoin's 67-Day Negative Funding Rate Record: What It Means in 2026
Frequently Asked Questions
What ended Bitcoin's 67-day negative funding rate streak in May 2026?
According to Bitfinex research published around May 10, 2026, and K33 data, the streak ended as BTC recovered from a low near USD 74,000 to above USD 81,000 between late April and early May. The short squeeze was partially catalyzed by ETF inflows, Iran de-escalation, and forced liquidations of large short positions including a USD 20.3 million 40x Hyperliquid short. Funding rates on Binance BTC perpetuals flipped to approximately +0.0043% by May 10, formally ending the streak.
Why does record open interest matter when Bitcoin is near $82,000?
Record open interest means more capital is committed to leveraged futures positions than at any prior point in history, including Bitcoin's 2025 all-time high. CryptoQuant analyst Darkfost noted that the absolute OI level and the single-day increase on May 9-10 both set new highs. Higher OI amplifies the size of a potential liquidation cascade: if price moves sharply in either direction, the forced unwind of losing positions can accelerate the move. With OI at record levels and USD 75,000 as the nearest major support, a breakdown would carry larger downstream liquidation volume than the roughly USD 1.2 billion in shorts cleared during the April 30 to May 7 rally.
What does the ETH inflow to Binance signal for altcoin prices?
Large ETH deposits to a centralized exchange typically indicate holders are preparing to sell, since exchange wallets represent accessible sell-side inventory. Between May 6 and May 9, over 314,000 ETH moved into Binance across three separate transactions. Combined with ETH open interest near a record 14.17 million contracts and a persistently negative perpetual funding rate of approximately -0.0038% on Binance as of May 10, the data points to a dual headwind for ETH: spot supply coming to market and derivatives shorts accumulating. Historically this combination has resolved through a sharp directional move once one side runs out of margin to sustain its position.


