Bitcoin's 67-Day Negative Funding Rate Record: What It Means in 2026
Bitcoin's funding rate went negative for 67 days straight in 2026, a 10-year record. What it signals for short squeeze risk and BTC price outlook.
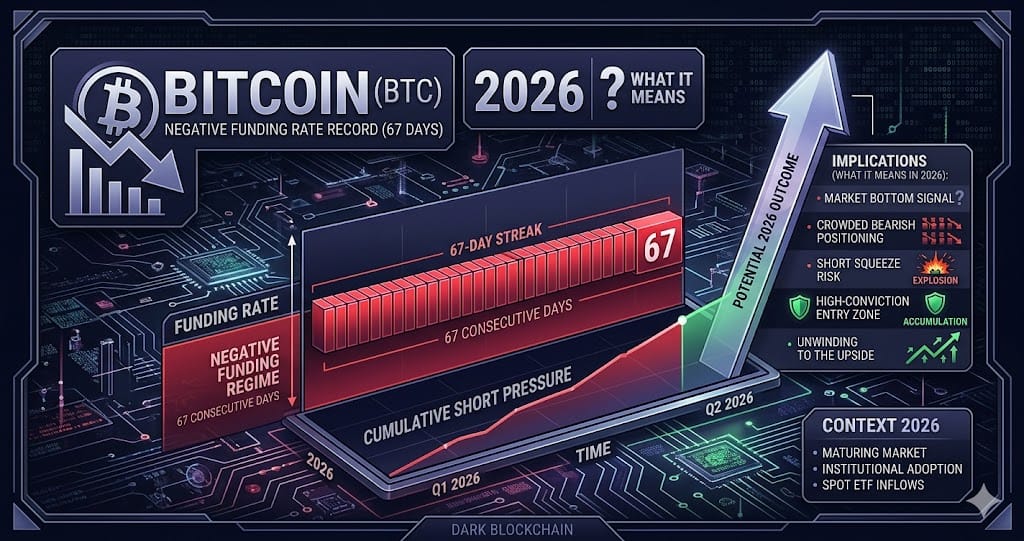
Bitcoin's perpetual swap funding rate stayed negative for 67 consecutive days as of May 8, 2026, according to K33 Research — surpassing the 46-day record set during the FTX collapse in November 2022 and marking the longest sustained negative funding period in over a decade. BTC pulled back to USD 79,614 on May 8 after touching USD 82,320 on May 7, while remaining up 3.3% on the week and 14% month-to-date, the strongest monthly gain since April 2025.
Concurrently, spot Bitcoin ETFs recorded USD 999 million in net inflows across May 5 and May 6 alone, pushing the first nine days of May to USD 2.7 billion and already exceeding April's full-month total of USD 2.44 billion. The collision of record-length negative funding, open interest holding near USD 61 billion, and accelerating institutional inflows creates a market structure with meaningful near-term implications for both directional and derivatives traders.
The 67-Day Negative Funding Rate: Breaking Down the Record
Funding rates on BTC perpetual swaps across Binance, OKX, and Bybit have remained below zero since approximately March 1, 2026. K33 Research confirmed on May 8 that the streak reached 67 days, eclipsing the 46-day benchmark from the FTX collapse in November 2022 and making this the longest sustained negative funding period since at least 2015. The synchronization across all three major exchanges rules out a single-platform liquidity anomaly — this is a market-wide structural imbalance. Live data is publicly tracked on CoinGlass.
Holding a short position through this streak carries a meaningful cumulative cost. At a weekly funding fee of roughly 0.5% to 1%, a short opened at the start of the streak would have paid approximately 6.7% to 13.4% in total funding across 201 eight-hour settlement cycles on Binance, OKX, and Bybit. This passive attrition is the mechanism analysts describe as a passive squeeze: the cost of staying short gradually forces exits without requiring any sudden price catalyst from the market.
Open Interest at USD 61 Billion and the USD 83,200 Short Squeeze Trigger
Negative funding rates normally coincide with declining open interest as shorts reduce exposure. Instead, BTC open interest held near USD 61 billion between May 5 and May 8 even as the funding streak set a new decade-long record. CoinGlass heatmap data showed approximately USD 590 million in short liquidation clusters positioned between USD 80,000 and USD 83,000. The OI-to-market-cap ratio reached 1.85% on May 5, above the historically healthy range of 1.0% to 1.3%, signaling elevated market-wide leverage.
CoinDesk's technical analysis on May 8 identified USD 83,200 as the price level at which a daily close would likely trigger forced exits across the 67-day short accumulation. Cumulative short liquidations from April 18 through May 7 already totaled approximately USD 1.215 billion across several discrete events, but the core passive short concentration built over the full 67-day window has not yet been triggered. The difference between the previously cited resistance of USD 83,600 and the updated USD 83,200 figure likely reflects a micro-adjustment in the 200-day moving average.
Structural Shorts vs Directional Shorts: A Critical Distinction
10x Research introduced a key interpretive adjustment: the raw short OI figure materially overstates bearish conviction. A significant share of the short-side positioning comes from three non-directional sources — hedge funds neutralizing BTC exposure during redemption windows, investment vehicles holding Bitcoin miner stocks (which have pivoted toward AI computing) shorting BTC to strip out crypto price correlation, and basis traders shorting perpetuals to capture the spot-perpetual spread. None of these positions represent a bearish view on BTC price.
If 30% to 40% of the USD 590 million short cluster identified in the CoinGlass heatmap consists of these structural hedges rather than directional bets, the actual forced-cover energy available above USD 83,200 is meaningfully lower than the headline figure implies. Traders sizing a short squeeze trade using only funding rate or OI metrics risk overestimating the upside impulse by a factor that 10x Research estimates at roughly 30% to 40% of the stated cluster value.
Three-Way Sentiment Divergence: Fear and Greed, Social FOMO, and ETF Flows
As of May 9, three sentiment indicators pointed in conflicting directions simultaneously. The Fear and Greed Index read 47, down from 74 just one week earlier — a 27-point drop while BTC moved from roughly USD 79,000 to USD 82,000, producing a clear price-sentiment divergence. Santiment's social-mining tracker simultaneously flagged bullish commentary at a four-month high, entering what the platform classifies as a FOMO Zone. This exact pairing appeared twice in Q1 2026, and each time a correction of 5% or greater followed within six to ten days.
ETF flow data provides the third, bullish, signal. Q1 2026 saw USD 18.7 billion in global crypto ETP net inflows, with BTC ETFs accounting for USD 12.4 billion. The May acceleration — USD 999 million in two days — mirrors the institutional accumulation patterns that preceded major BTC rallies in January 2024 and October 2025, when retail sentiment was similarly subdued. ETH open interest concurrently reached 14.17 million ETH, its highest since April 18, extending the elevated-leverage dynamic beyond Bitcoin to the broader large-cap derivatives market.
What to Watch
- BTC daily close above USD 83,200: CoinDesk identified this on May 8 as the technical trigger for the 67-day short accumulation to cascade; volume confirmation on the break is required to distinguish a squeeze from a false breakout
- Funding rate normalization on Binance, OKX, and Bybit: a shift in the BTC perpetual 30-day average from negative toward zero or positive would signal that the structural passive squeeze pressure has materially cleared
- Spot ETF daily net flow pace: the May 5 to May 6 combined pace of USD 999 million sets the acceleration benchmark; sustained deceleration below USD 200 million per day would weaken the institutional accumulation thesis and remove a key bullish counterweight
- Santiment FOMO Zone vs Fear and Greed convergence window: the divergence between social FOMO and algorithm-derived Fear (index at 47) has historically resolved via a 5%+ price correction within 6 to 10 days — the window opened approximately May 8, 2026
Ready to start trading?
Trade on Bitget Try CoinTech2uAffiliate links — we may earn a commission at no extra cost to you.
Related Articles
- Bitcoin's 66-Day Negative Funding Streak and the May 2026 Liquidation Cascade
- Crypto Market Sentiment Breakdown 2026: Fear, Funding Rates, and Macro Risk Signals Explained
- 2026 Crypto Narratives Explained: BTCFi, DeFAI, AI Restaking, and Capital Rotation Trends
Frequently Asked Questions
What does a 67-day negative Bitcoin funding rate mean for traders?
It means traders holding short positions on BTC perpetual swaps across Binance, OKX, and Bybit paid a funding fee to long holders every eight hours for 67 consecutive days through May 8, 2026. At roughly 0.5% to 1% per week, the cumulative cost across 201 settlement cycles reached an estimated 6.7% to 13.4% per position. This is the longest negative funding streak in over ten years, surpassing the 46-day record from the FTX collapse in November 2022, and it creates passive exit pressure on short holders regardless of price direction.
Why is USD 83,200 the short squeeze trigger for Bitcoin in May 2026?
CoinDesk's technical analysis on May 8, 2026, identified USD 83,200 as the level where a daily close would likely force mass liquidation of short positions built up during the 67-day negative funding period. CoinGlass heatmap data places approximately USD 590 million in short liquidation clusters between USD 80,000 and USD 83,000, with USD 83,200 at the upper boundary of that zone. Importantly, 10x Research estimates that 30% to 40% of those shorts are structural hedges rather than directional bets, so the actual cascade energy may be lower than the raw figure suggests.
Is the record-length negative funding rate a bullish or bearish signal for Bitcoin?
Historically, extended negative funding rates reflect over-crowded short positioning and have preceded upside reversals as accumulated funding costs force exits — a bullish setup by that measure. The concurrent spot ETF inflows of USD 2.7 billion in the first nine days of May 2026 reinforce that read. However, the Fear and Greed Index dropping 27 points in one week to 47 while Santiment shows peak social FOMO is a near-term caution flag, as this divergence preceded corrections in Q1 2026. The OI-to-market-cap ratio at 1.85% also exceeds the healthy threshold of 1.0% to 1.3%, indicating that leverage is stretched regardless of directional bias.


